How to Successfully Establish a Correlation between Contact and Optical Surface Measurements
Contact stylus and noncontact optical can show excellent correlation.

Figure 1: Traceable surface roughness master artifact
Many use the phrase surface metrology interchangeably with roughness measurement, but it actually has a much wider meaning that includes measurement and quantification of periodicity; geometry; size; shape and number of discrete features and shapes; height or spacing based statistics; etc. In short, surface metrology includes any and everything that can be calculated from an X, Y, Z dataset that represents the measured surface.
Surface finish is a critical component of the engineering process as it affects how a part will fit, reflect light, transmit heat, wear, distribute lubrication, accept coatings and more. The proper analysis of these engineered surfaces relies heavily on choosing the right measurement procedure.
Today, noncontact optical measurement devices offer new insights into surface structures and processing alongside established contact stylus technology. In my last article on this topic, I provided guidance on how to make the right choice between contact or optical, as both are often capable of delivering comparable results. The best approach ultimately depends on the specifics of the individual use case, the related requirements of the target application, and relevant standards requirements.
Contact is the most widely accepted, fast, and typically lower cost choice for surface finish validation of well-understood surfaces and processes. Contact instruments are intuitive, and have been the historical basis for development and measurement of engineered surfaces. Noncontact optical instruments are the better choice when the surface is technically complex, additional statistical certainty is required, the surface is too small for measurement by contact means, or the material properties are such that noncontact is needed.
The choice of methods will naturally bring the question: if I have historically been using a contact instrument but now use an optical noncontact instrument, how will the data it provides compare to the stylus data that my customers, suppliers and I have been using for decades? This article will demonstrate that contact stylus and noncontact optical can show excellent correlation.
Noncontact Surface Measurement Review
Contact measurement is achieved by tracing the surface to be measured with a diamond of a standardized radius mounted on a tracing arm, which is in turn mounted on the pivot of an analog pick-up. The resulting output is generally a plot of surface height over the length of the trace and the results of parameter calculations, for instance, Ra and Rz.
Stylus systems are extremely valuable for use in many industrial settings, and are commonly used for applications where specifications and processes are well-defined (technical drawing callouts); applications where the customer or vendor has provided standard operating procedures (SOP) for measurement; and situations where the measurement SOP is well understood and documented. In most cases, this SOP is based on ASME or ISO standards and is preprogrammed into the measuring device.
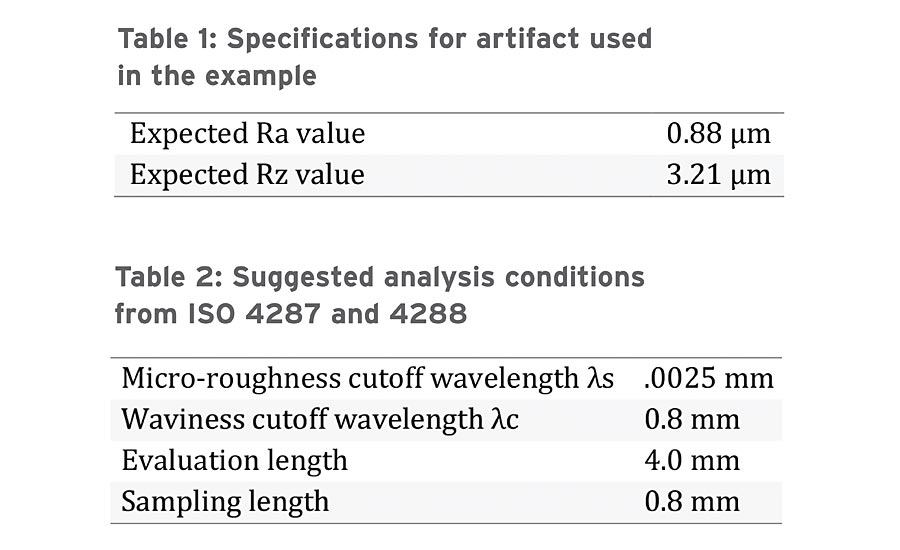
Table 1: Specifications for artifact used in the example
Table 2: Suggested analysis conditions from ISO 4287 and 4288
Optical Surface Measurement Review
Modern surfaces have an increasingly technical function because of new processes and materials, as well as a more advanced understanding of coating, bonding, lubrication, friction, etc. The surface structure therefore becomes an increasingly important element to ensure specified performance.
Structures on many advanced engineered surfaces may not be directionally aligned, and instead are distributed stochastically—and these randomly distributed structural elements may not be well characterized by the individual profiles produced by stylus instruments. If the application requires a better understanding of the surface structure and profile information is not sufficient, optical instruments, which provide a much larger point cloud (also referred to as 3D) dataset, should be used. This 3D data can be used to calculate a relatively new group of parameters—areal surface texture parameters.
Areal surface texture measurements from optical measuring devices are extremely useful when there is a requirement to focus on functional structures such as protrusions or depressions, and for determining tribological parameters and the load bearing ability of surface. For example, when evaluating inhomogeneous and porous surfaces such as ceramics and cast materials, nondestructive, material-independent surface quantification is needed.
In these cases, an areal measurement using an optical instrument provides more in-depth information about the structure of a particular surface. This creates a 3D topography map that includes highly detailed information about the height, intensity and color across every point in the measurement area, enabling a true representation of complex features.
Correlation between Contact Stylus and Noncontact Optical Measurements
Any time a new gage technology is introduced there are concerns about whether the results will correlate with those from previous technologies. For example, finding that the roughness of a part as reported by an optical instrument is substantially different from the roughness reported by a stylus instrument—while the actual surface being manufactured is constant—would be a challenge in the implementation of optical surface metrology.
Typical contact surface finish instruments are preprogrammed to conform to ISO or ASME standards with little or no input from the user. The user can push the green button and the instrument will automatically acquire the data, process it and provide a simple report as well as a single numerical value for the programmed parameters.
However, there is a significant amount of processing that needs to take place for this seemingly simple result to be displayed. For the purposes of this discussion, we will concentrate on the Ra and the Rz parameters.
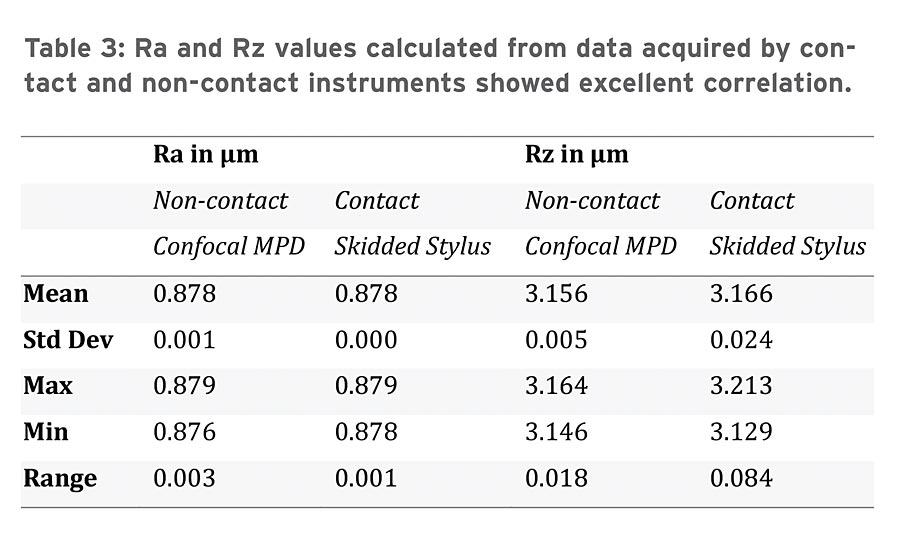
Table 3: Ra and Rz values calculated from data acquired by contact and non-contact instruments showed excellent correlation.
Standards for Measuring Surface Roughness
ISO 4287 and ISO 4288 provide almost all of the information needed to calculate a wide range of profile, roughness and waviness parameters. The information pertinent to Ra and Rz calculations below will be reviewed in reference to these standards.
First, ISO 4287 defines the calculations used to arrive at each of the many surface finish parameters. It also defines what portion of the raw acquired profile is used for these calculations. The description of the calculation is quite straightforward. For Ra, also known as the arithmetic mean deviation, the calculation is as follows:
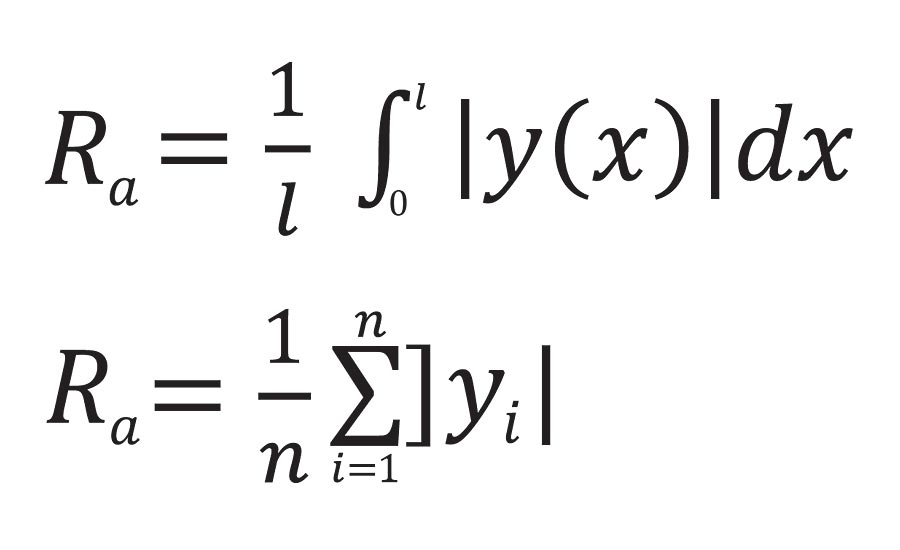
For the discrete (lower) equation, “n” is the number of data points in the sampling length and “yi” is the absolute value of the difference between the actual height at that position and the mean height of the sampling length. In simple terms, Ra is the average distance from the mean line of all data points in the sampling length of the profile.
Rz is relatively simple: it is often calculated by measuring the vertical distance from the highest peak to the lowest valley within five sampling lengths, then averaging these distances.
While the calculations of Ra and Rz may be simple, this is not yet the full picture. In addition to providing descriptions of the parameters, the ISO 4287 standard also provides instructions for identifying the components of the acquired profile data that will be used for the primary, roughness and waviness parameters. Gaussian filtering is used to separate the measured profile into these different components.
The ISO 4288 standard provides explicit, detailed guidelines regarding what size Gaussian filter to use and how long of a profile to acquire to analyze these parameters. Most state-of-the-art surface finish instruments have integrated software that automatically, or semi-automatically, takes ISO 4287 and 4288 into account when producing roughness and waviness parameters.
For the measurement of Ra and Rz using a noncontact optical instrument, all of the same rules apply. ISO 4287 and 4288 still provide the guidance for the mathematics, filtering and acquisition portion of the measurement. The difference in the process comes in how these ISO guidelines are implemented. Because instruments that acquire areal (3D) data are often used for much more than just the calculation of Ra, Rz and other roughness parameters, the user is responsible for making sure that the analysis of the raw data conforms to these standards. This step is the most critical but often the most overlooked.
Naturally, the noncontact instrument must have the resolution and sensitivity to collect data with superlative fidelity to the measured surface. The instrument must also be calibrated correctly using traceable calibration artifacts. The same is required for the contact surface finish instruments. There is no logic in checking the correlation of un-calibrated instruments.
Comparison Study with Contact and Noncontact Tools
A confocal multi-pinhole disc instrument and a skidless diamond tip stylus instrument were used to measure the same traceable roughness artifacts detailed below. The resulting Ra and Rz values of these measurements were compared to check correlation.
The artifact used was similar to the one shown in Figure 1. The important specifications for this artifact are shown in Table 1. The required analysis conditions as suggested by ISO 4287 and ISO 4288 are shown in Table 2.
The artifact was measured 25 times with both the confocal multi-pinhole disc instrument and the contact stylus instrument. The artifact was not removed and replaced between measurements. The suggested analysis conditions as laid out in Table 2 were used to calculate Ra and Rz. The average, range and standard deviation of these measurements are shown in Table 3. The results demonstrate the close correlation between the contact and noncontact instruments on the surfaces of master artifacts.
Conclusion
Surface finish is a critical component of product engineering, and the proper analysis of these engineered surfaces relies heavily on utilizing the right measurement procedure. New noncontact optical measurement devices and established contact stylus technology are often capable of delivering comparable results. The best approach should be selected based on the specifics of the individual use case, the related requirements of the target application, and relevant standards requirements.
However, regardless of which tool is ultimately used, it is important to understand how the data between the two can be effectively correlated. By following the steps mentioned in this article, correlation of results between contact and noncontact tools is achievable. Q
Looking for a reprint of this article?
From high-res PDFs to custom plaques, order your copy today!


