Software
Using Data to Drive Organizational Action
The primary challenge for quality professionals is not acquiring sufficient data but collecting the right data and analyzing it correctly.

Image Source: B4LLS / iStock via Getty Images Plus
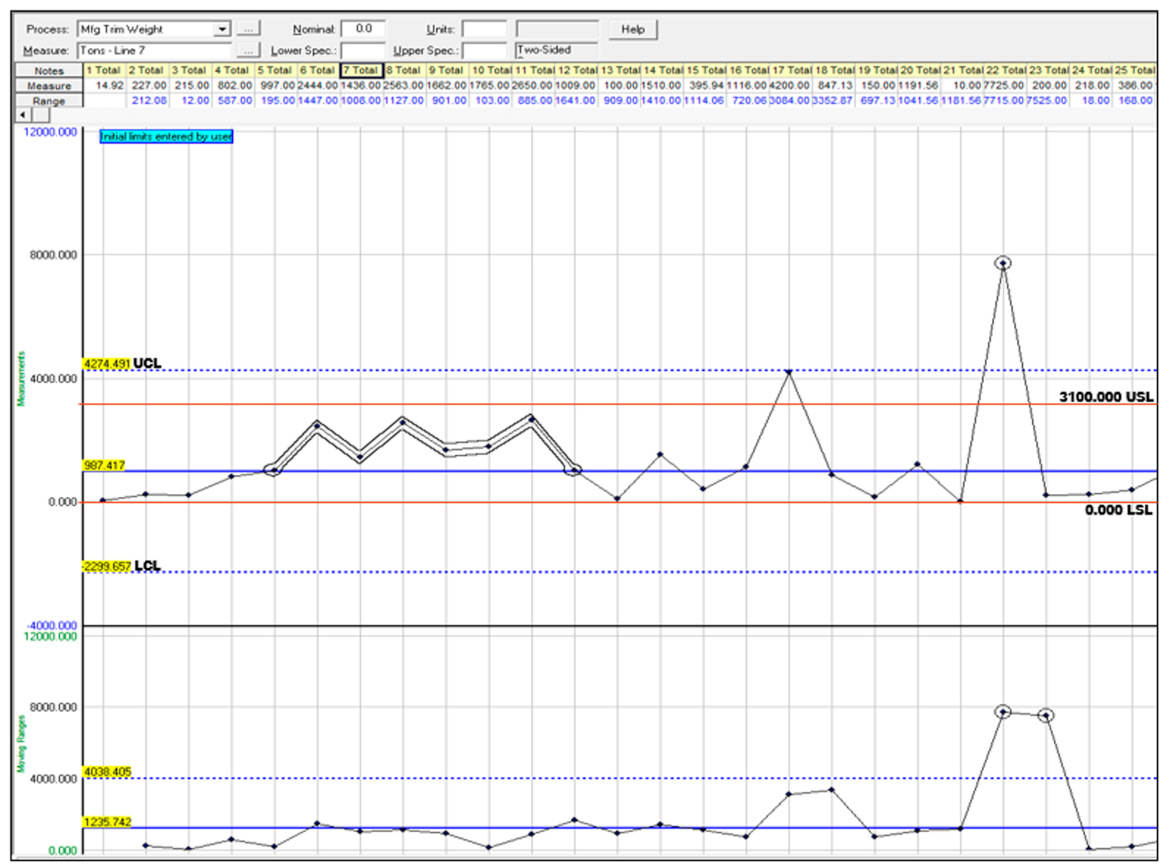
In today’s technology-driven world, companies are inundated with software solutions designed to capture vast amounts of data. This data is often used to guide or justify actions and agendas. However, the analysis derived from this data is frequently flawed from the start. Organizations rely on software-generated charts to explain internal dynamics, but these charts often present a distorted picture. Common issues include run charts with only specification limits, arbitrarily chosen warning and action limits, or Process Behavior Charts (Control Charts) misused by adding specification limits [See Fig. 1]. Even Metric Boards with color coding based on arbitrary data ranges contribute to misinterpretation.
The primary challenge for quality professionals is not acquiring sufficient data but collecting the right data and analyzing it correctly. To navigate the pitfalls of today’s data-mining world, one must overcome barriers created by upper management and the widespread lack of knowledge associated with powerful software solutions.
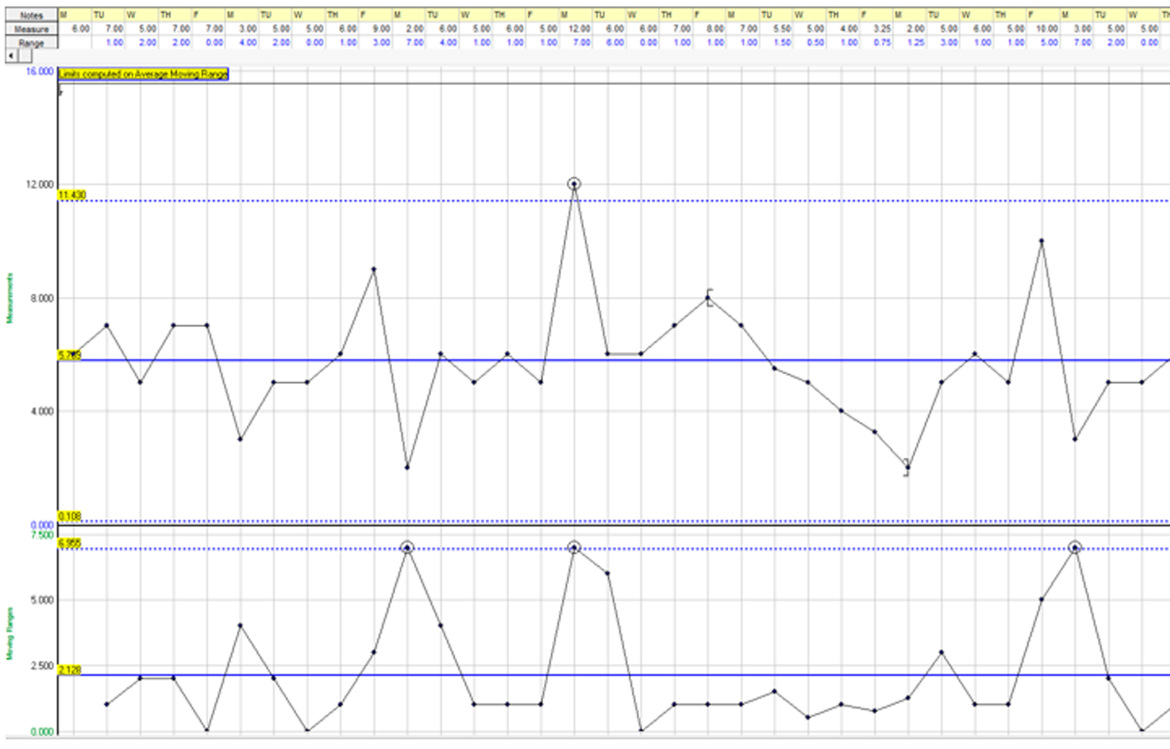
One of the most widely used software tools for quality analysis and control is the Control Chart which has been a staple in Statistical Process Control (SPC) for decades. It is used to monitor process variability and detect signals indicating significant changes. Most quality professionals are familiar with Control Charts and their application. However, when Dr. Donald J. Wheeler acknowledged the term “Process Behavior Chart” (PBC) [see Fig. 2], in the second edition of his book Understanding Variation, as a more accurate name for this tool, it was intended to highlight its power and versatility. Despite this, the renaming has not fully captured the attention of quality professionals, engineers, and managers as it should. Instead misuse and misinterpretation of data continues to dominate the landscape.
The Flaw in Letting Specifications Drive Quality
When organizational actions are driven solely by product or service specifications, the true nature of what is happening is often missed. Focusing exclusively on specifications neglects the underlying process that generates the actual results which may not be what was intended or desired. Without standard work procedures, results become neither reproducible nor predictable. Employees left to their own devices can produce varying outcomes based on personal approaches and external factors such as attitude and environmental conditions like temperature, humidity, and power outages.
Automated controls, such as on-screen process behavior charts, can lead to the “fiddle-factor” where employees react prematurely to perceived issues, often before signals are properly investigated. This reaction can destabilize the process, resulting in unpredictable outcomes.
Understanding Process Behavior vs. Specifications
A common misconception is that merely meeting specifications ensures good products and services. However, specifications and process behavior come from different sources. Specifications are derived from customer requirements, desires, and cost considerations, which may include inputs from engineering, manufacturing management, or upper management. These specifications do not drive results; how the process operates does.
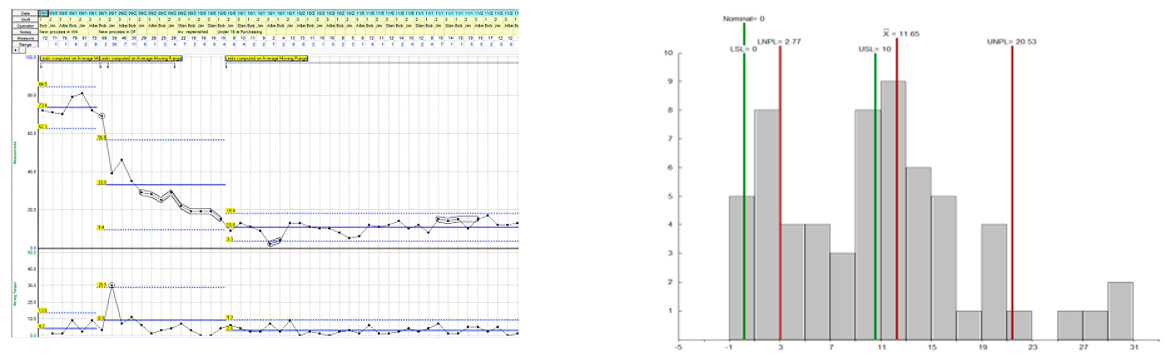
Processes are designed based on machine capabilities, experiences, and knowledge, often by well-meaning individuals aiming to satisfy customer needs. However, until the process is operational, the actual results remain unknown. Overlaying specifications on top of a Process Behavior Chart to drive actions misses the reality of process performance. The process does not understand specifications, and reacting solely based on specification compliance can lead to unnecessary adjustments, destabilizing the process. To understand how specs relate to the process, create a histogram from the collected data with the specs to show the capability of the process to function in the desired manner. [See Fig. 3]
The Cost of Specification-Focused Activity
Focusing on meeting specifications can lead to significant waste, including defects, excess inventory, unnecessary motion and travel, and excess processing. This waste incurs substantial costs. Running a process until it produces a batch of defective parts often overlooks underlying issues. This mindset results in the accumulation of defective parts, necessitating quality hold or Material Review Board warehouses. Additional costs arise from inspection and rework labor, and there is always a risk that defective parts may re-enter the production cycle, causing further defects.
Employees can also manipulate processes by ignoring defects, incorrectly measuring or entering data, or intentionally logging incorrect information to avoid dealing with defective parts. These scenarios not only waste time and money but can also damage the organization’s reputation.
Developing a Process-Focused Plan
Accurate measurements are essential for gauging performance against goals, determining product or service quality, profitability, and employee performance. The challenge lies in avoiding pre-determined measurements set by executive management or focusing solely on specifications when developing quality metrics.
Measurements should focus on the process, not just the end results. To be effective, organizations need to measure the process and investigate it when signals arise. This approach helps in identifying the actual issues rather than reacting to surface-level data.
The Power of Process Behavior Charts
Every process, once designed and implemented, exhibits specific behavior. Understanding this behavior is key to driving actions and results. The Process Behavior Chart (PBC) is the most effective SPC tool for this purpose. Regardless of initial design intentions, the actual process performance is revealed through data and PBCs. Running the process without adjustments for a trial period allows for the collection of meaningful data that provides great insight about the process behavior and its outcomes.
Whether you actually practice Advanced Product Quality Planning (APQP) or not, utilizing phases of APQP, such as Process Failure Modes and Effects Analysis (pFMEA) and Control Plans, helps in identifying known and unknown defects. Using PBCs as a primary investigative tool during these phases ensures long-term process predictability and repeatability.
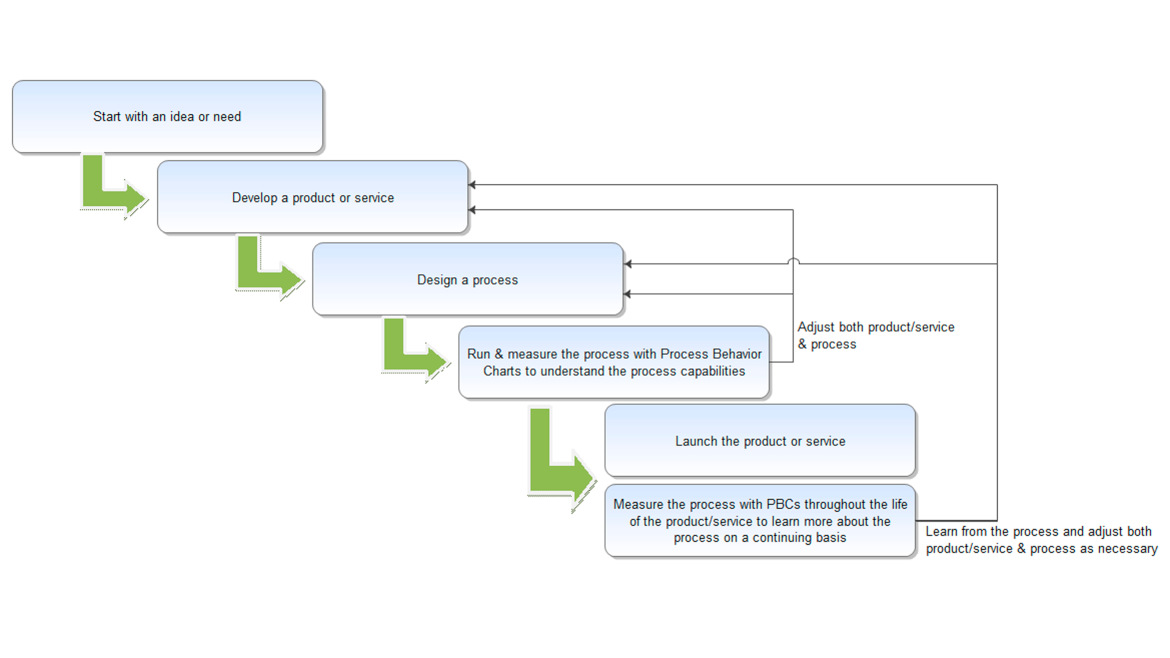
Maintaining Success with Process Behavior Charts
Once pFMEA is completed and Control Plans are in place, the process should theoretically run predictably. However, processes can drift or fail over time. PBCs provide a continuous method for investigating signals, involving employees in the process. Employees should understand the purpose and function of PBCs and be able to track and document process data accurately. This involvement ensures that employees become part of the solution, making decisions based on meaningful data. From the point of product or service design, through the process development phase, and into ongoing operation of the process, continual feedback is necessary to ensure success. [See Fig. 4]
Achieving Success with Data
To pursue quality excellence, avoid rigid requirements and mandates set by executive management or other entities detached from the process. Create process-focused metrics that are meaningful to employees, and then develop supporting metrics for products or services. Avoid using software that you do not fully understand. If you lack knowledge about a software module or formula, the results it produces can be misleading. Continuous learning and knowledge dissemination within the organization are crucial to maintaining an in-depth understanding of tools and processes.
Statistical Process Control (SPC) tools should only be used if fully understood. Each SPC tool has a specific use and provides valuable insights when applied correctly. All employees should be taught the basic concepts of these tools to understand their purpose and application in measuring the process. Focusing on process signals rather than results as primary metrics ensures that the process remains predictable, leading to improved product and service quality.
PBCs as a Management Tool
Organizational actions based on solid process analysis yield faster and more accurate results compared to reactive approaches. PBCs help in distinguishing routine variation from significant signals, allowing organizations to focus resources where problems truly exist. PBCs have applications beyond establishing predictable processes, including better inventory control and faster root cause analysis. Even strategic planning can benefit from understanding current process capabilities through PBCs.
In conclusion, to drive organizational action from data, consider Walter Shewhart’s century-old concept of the Control Chart, now known as the Process Behavior Chart. With modern technology, generating and interpreting these charts is faster and more efficient, facilitating structured discussions and informed decisions across the organization.
Looking for a reprint of this article?
From high-res PDFs to custom plaques, order your copy today!


