Ask the Expert | Dr. Sophronia Ward
Capability Analysis Follow-Up
Here we'll cover the specifics of a capability analysis and several sticking points in interpreting and taking action on information from the analysis.
In their day to day work activities, both quality and manufacturing professionals are involved in conducting audits; collecting, analyzing, and interpreting data; plus preparing a variety of reports and summaries of the data to document product quality. This work is critical to assuring that customers will receive products that meet their quality specifications as well as requirements for quantity, cost and delivery date.
All quality professionals, regardless of educational background and/or experience will at times find a need to consult their network of resources to get answers to questions, determine how best to collect and analyze data, or resolve different interpretations of a given analysis. Recognizing this need, Quality is launching a column entitled “Ask the Expert: An Interactive Q&A Section” with topics that come from the readers.
Customers ask of a supplier, “Do all parts meet my product specifications for each and every shipment?” The June 2020 Ask the Expert column presented two cases with typical capability analysis results, plus questions posed by the supplier or customer management. To answer these questions, quality professionals must interpret the analysis results presented and resolve any potential confusion to the satisfaction of both sides.
But if capability analysis is the “go-to” technique, why do managers continue to ask questions such as those posed in the previous column? Two reasons come to mind. First, the traditional results of a capability analysis are presented in technical terms for quality or engineering purposes and many managers do not have this technical knowledge. Second, managers on either side want information in “plain English” that will lead to actions, but the technical results often times lead to contradictions in interpretation.
This follow up column covers the specifics of a capability analysis and several sticking points in interpreting and taking action on information from the analysis.
Capability Analysis - Specifics
Customers expect consistency in supply, as well as conformance to specifications. Thus, the capability analysis must answer two questions. (1) Is the process that produces the parts operating in a predictable, stable, and in statistical control manner? (2) Does the output of the process meet the specification for each and every characteristic (CTQ)?
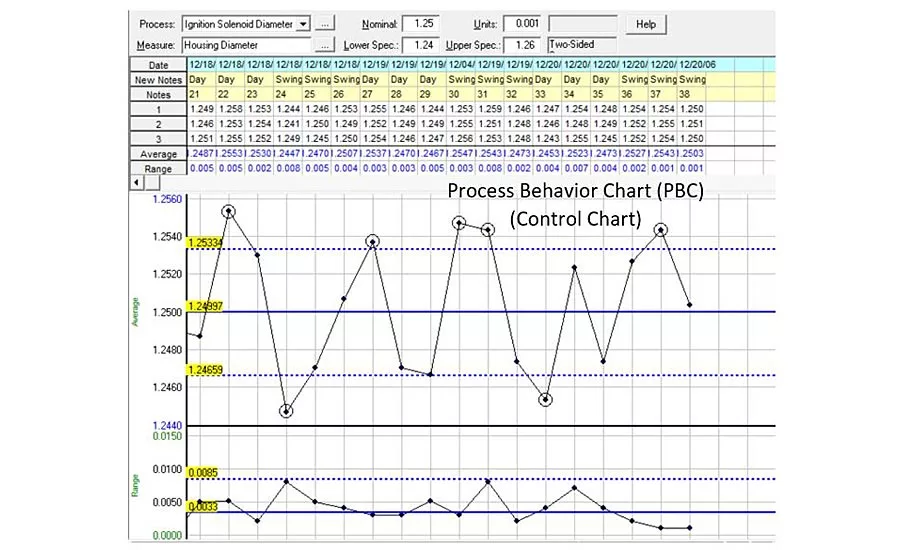
Answers to both questions use data (measured values of the CTQ) collected over time from the product produced by the process. A process behavior chart (PBC), commonly known as a Shewhart control chart, answers the question of predictability showing how the process behaves over time. A histogram of the same data used for the PBC compares actual product values to specifications for the characteristic.
These two charts together – the PBC and the histogram – provide sufficient evidence of process capability. Capability indexes (Cₚ, Cₚₖ Pₚ, and Pₚₖ), while not necessary for the analysis, are often included automatically or by request. These indexes are problematic at best because they don’t add information to the analysis. Furthermore, if not clearly understood, they can add to confusion about the messages from the analysis. For capability analyses, a picture (or chart or two) is worth 1,000 words.
Capability Analysis – Sticking Points
When interpreting and communicating results of a capability analysis, there are typically three main sticking points. These are: (1) the importance of process stability or predictability over time; (2) whether or not all of the data values fit inside the specifications; and (3) capability indexes can create confusion.
First, an unstable or unpredictable process does not have a well-defined capability because the process is changing over time. Even if all parts in a given shipment meet specifications, or all values of a CTQ are inside the specifications on a histogram, such a process cannot be counted on to produce products that meet specifications each and every time. Without a PBC, or control chart, both the quality professional and the managers asking questions can be in the dark as to process stability. Always include a PBC as part of a capability analysis.
Second, there are three cases that lead to parts out of specification for a characteristic. (1) The process is predictable, but not centered, as shown on the histogram. (2) The process is centered with too much variation to fit in the specifications. (3) The process is unpredictable and can have parts out of specification regardless of the current average and variation in the data.
Third, capability indexes summarize the comparison of actual data values to the specifications for a CTQ. These indexes are dimensionless and may lead to confusion. Cₚ and Cₚₖ are appropriate for a process that is predictable or stable while Pₚ and Pₚₖ are used when the process is not predictable. If both sets of indexes are calculated for a predictable process, the answers will be similar. For an unpredictable process, the two sets of indexes will be different, with Pₚ and Pₚₖ somewhat smaller than Cₚ and Cₚₖ depending on how much the process is changing over time. While these indexes may contain important information to the quality professional or engineer, the intent and significance is generally lost on management due to a lack of the specific statistical skills used to understand these indexes.
Consider These Sticking Points For The Two Examples In The Article.
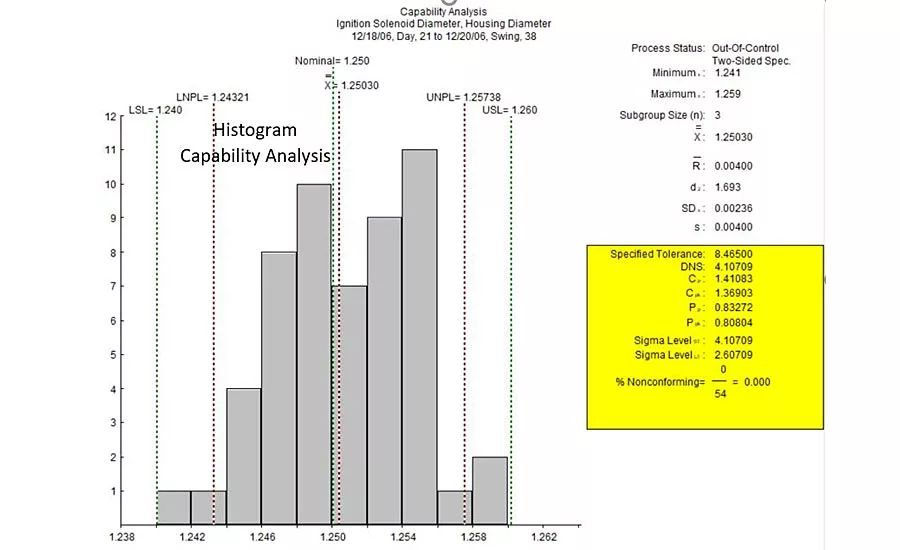
Ignition Solenoid Housing
The histogram for the Ignition Solenoid Housing example shows all parts used in the analysis met specifications. However, when used in production, some parts did not fit. Had the PBC been included as part of the capability report, it would have shown that the process was unpredictable which could lead to parts not meeting specification.
In the absence of the PBC, there are three clues included with the histogram that suggest the process was unpredictable. These are (1) Process Status: Out-Of-Control at the top of the summary column on the right; (2) the position of the Natural Process Limits (NPLs) on the histogram showing that there are product values within the specifications but outside the NPLs; and (3) the capability indexes Pₚ and Pₚₖ are smaller than Cₚ and Cₚₖ.
Key Blank Length
The Key Blank Length example shows all parts inside the specifications with an average that is slightly higher than mid-specification. Again there is no PBC to verify how the process behaves – predictably or unpredictably. Given that the NPLs are very close to the specification limits, this process may be predictable.
Since the hardware store employees are having issues with the key blanks fitting into the equipment and the final customers were complaining that the keys didn’t work, it is possible that the data used for the capability analysis came from a different production time than when the key blanks were actually made. If the process is not predictable, the capability analysis may not be appropriate for the product that was delivered to Keys R Us.
Going forward, Janet’s challenges are two-fold: (1) use a PBC to bring or maintain the process into a predictable state; and (2) reduce the variation in the process to give some breathing room inside the specifications. Setting an arbitrary cutoff at Cₚₖ = 1.33 is no guarantee that this process will meet specs.
Capability Analysis – Summary
The best analysis is the simplest analysis that answers the two essential questions. (1) Is the process predictable? And (2) Do all the parts meet specifications? The combination of a PBC to analyze process behavior and a histogram that compares actual product values with the specifications has all the details necessary to assess capability, including the timing of the data to match the production of the product.
Communicating between quality professionals and management, suppliers and customers is easier using the PBC and histogram. Everyone involved can “see” the results and come to agreement on actions. The quality professional, as well as engineers, must be able to successfully communicate their findings and associated information, not just to each other but to management and customers. Sometimes simpler is better.
For the first column, visit https://www.qualitymag.com/articles/96097-capability-analysis.
Looking for a reprint of this article?
From high-res PDFs to custom plaques, order your copy today!


