Variation, deviation: Marge comes to terms with variability
Quality UPDATE newsletter
 Answer:
No. It is clear that Marge Orrine has no clue about the meaning of her formula, impressive as that formula seems.
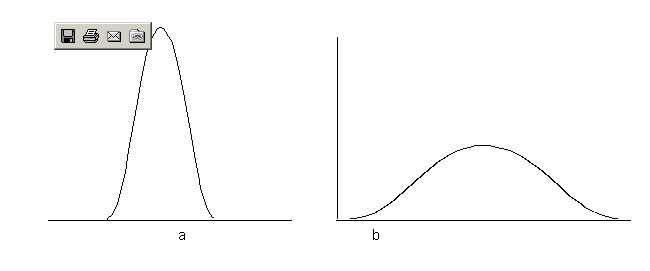
The concept of standard deviation reflects the amount of variability in the data:
Answer:
No. It is clear that Marge Orrine has no clue about the meaning of her formula, impressive as that formula seems.
The concept of standard deviation reflects the amount of variability in the data:
 This is how Marge came up with a standard deviation of 3:
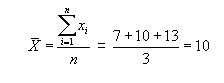
Step 1: Determining the mean of the data:
This is how Marge came up with a standard deviation of 3:
Step 1: Determining the mean of the data:
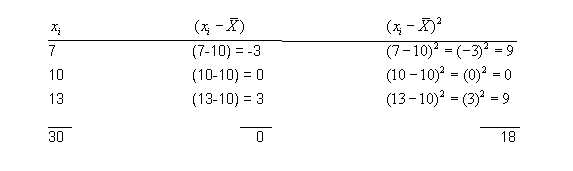 Step 2: Determine the sum of the squared deviations of the mean:
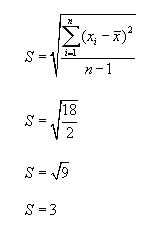 Step 3: Plug data into formula to calculate standard deviation.
Maybe Marge will read this quiz to improve her understanding of standard deviation.
Maybe Marge will read this quiz to improve her understanding of standard deviation.
Looking for a reprint of this article?
From high-res PDFs to custom plaques, order your copy today!


