How Not to Fear the Gage R of Your Leak Test
Turn Gage R into a tool for continuous quality improvement.
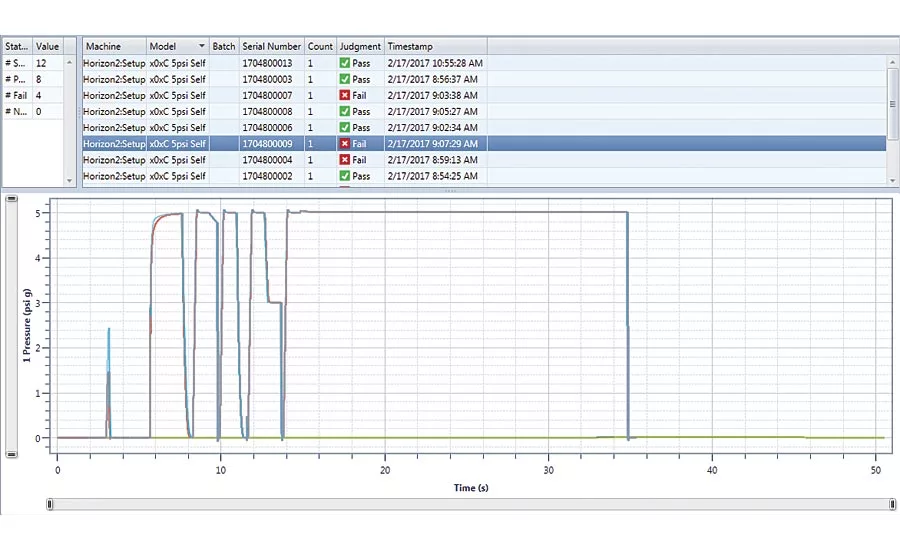
System Self Check waveforms. Small variation can be seen in the red waveform, caught with daily verification testing.
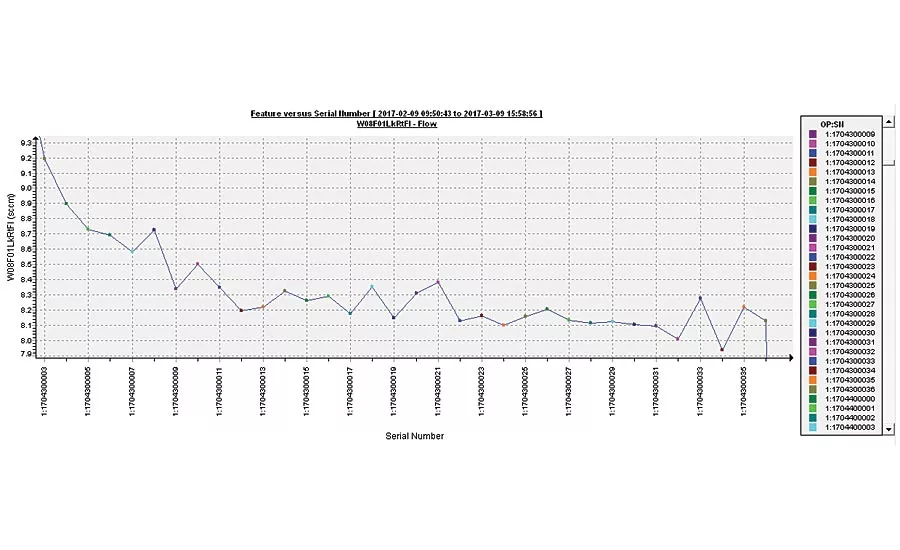
Test data showing a part heating up before stabilizing to a steady leak rate.
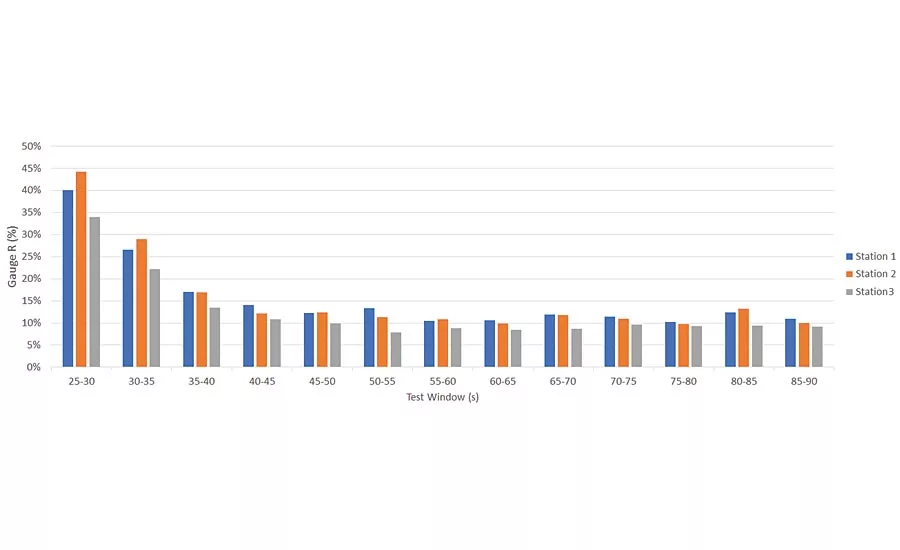
Gage R comparison across three stations running the same part. Test data shows consistency across leak stations, and the effect of varying test time on test repeatability.
Many quality engineers don’t know the Gage Repeatability and Reproducibility, or Gage R&R, of their leak test. Many, frankly, don’t want to know because they fear how poor it may be.
We are big fans of focusing on the first R: repeatability. This is the degree of variation between measurements that occurs when repeating the same measurement.
By focusing first on Gage R we can exclude all the controllable variables that can impact the leak test regardless of the equipment—sealing variations, operator behaviors and so forth. The goal is to determine what the test system, including the part and connectors, is capable of in the absence of all these other external variables.
You can’t effectively manage these variables if you don’t first have confidence in the reliability and repeatability of your test equipment.
In this article, we’ll explore some ways to make your Gage R benchmarking for leak testing as effective and painless as possible. But first, a true story.
Leak testing that was full of holes
We worked with one engine manufacturer that had engine lines around the world operating with no single quality standard in force. With an engine block coolant cavity, for example, one plant’s acceptable leak limit was measured in dozens of cubic centimeters. At another plant, the acceptable limit was measured in hundreds. This lack of consistency revealed itself in engines from one plant having far higher failure rates and warranty claims than the same engines produced at others.
Because the manufacturer did not track Gage R, it was all but impossible to confirm if this variance arose from issues with the test equipment, operator behavior or some other upstream issue that had nothing to do with the leak test. Complicating matters was inconsistency in test methodology: one plant would leak test the coolant cavity at eight PSI, another at 15 and yet another at 20.
We began by creating a single standard for test pressure and test limits and did Gage R studies on these to determine what performance benchmarks could be expected of the current leak testing equipment. We created a single measuring stick for repeatability. Focusing on Gage R for a single part yielded insights for improvements that could be applied system-wide. We then applied waveform signature analysis tools to drill deeper to understand how the actual measurement could be improved, aside from the process.
Once we had arrived at an acceptable Gage R, we could then focus on the other variables to see what additional improvements could be made, such as changing the types of seals or the fill locations on the part, or moving the test station to a different location in the plant with less variance in ambient air temperature. In one instance, we discovered the cycle time for the leak test was simply too short for adequate repeatability—the only way to hit the mark for quality was to add parallel test stations, but the quality improvements justified the capital expenditure.
Here are some of the steps we took with this manufacturer to turn Gage R from something to fear into something to value as a tool for continuous quality improvement.
Start by collecting the full waveform
Every single manufacturing test or process generates a digital process signature that can be recorded, interpreted and visualized. A single signature can contain hundreds and even thousands of data points.
By equipping a manufacturing process, or a test station like leak, with appropriate sensors such as temperature, flow and pressure sensors, highly consistent and repeatable signals can be obtained that directly indicate the consistency and quality of the process or product.
Once you have captured the digital process signatures, they can be analyzed, overlaid and compared. In its most simple form, signature analysis is the comparison of a specific process response or waveform against an acceptable pre-determined response. This is crucial to improve Gage R.
Use a master part
Also known as a zero-leak master, this is a known good part that is used to verify the leak tester and all associated fixturing. It’s like the control in a lab experiment, used to directly simulate the actual test requirements.
Maintaining master parts is a practice that is often overlooked. Few parts maintain the same characteristics over time. It’s therefore crucial that test results of each master part be databased and tracked over time so that proper maintenance can be scheduled as the master parts degrade and a test failure isn’t wrongly attributed to the leak test system.
Verify the system
This test checks the overall health of the test station including the leak tester, part seals, fill ports, connection hoses and pressure sensors. All part seals and fill ports are connected to a verification tool, typically a machined manifold that simulates all connections to the test part. This verifies there are no leaking seals or hoses and that any leak measured in a part is correct. If a leak is measured, seals can then be individually checked to find the failure.
Records of each system verification and individual seal test should be stored alongside the rest of the signature data from the test station.
Verify orifices
The most common external check for leak test instruments is a calibrated flow orifice or standard. Designed and certified to flow a set amount of air at a set pressure, orifices are a robust, cost-effective way to verify that the leak tester is reading the proper flow rate. Orifices do have a few limitations that must be considered. The accuracy of standards can vary depending on the style of the orifice. Temperature and barometric pressure variations must also be accounted for to ensure accurate measurement.
Eliminate environmental variables
Doors opening and closing, HVAC systems switching on and off don’t seem all that significant, but they can have a significant impact on test repeatability if they flood the test area with a sudden influx of warm or cold air. The solution may be as simple as putting a cardboard box over the part or building a full Plexiglas enclosure.
Consider too the impact of barometric pressure on the part’s measured leak rate. Test results at sea level will not be the same as test results at, say, 5,000 feet.
Consider the part’s temperature
Washes and baking processes can leave a part warmer than the ambient air. Warmer parts don’t allow heat to leave the air in the part and consequently show a higher leak rate. Filling the part also warms it up, possibly giving a false fail on a retest if sufficient relax time is not given. Once you have Gage R dialed in, go back and look at how this variable can be either compensated for or eliminated during regular production.
Clamp, test, repeat… repeatedly
To avoid introducing variables, it’s important to clamp the part once and leave it there while running the test repeatedly.
Remember we are just referring to the first “R.” Our approach is to run the test 40 times and drop from the data the first few runs as the system stabilizes. This ensures that the temperature increase and decrease of the part is the same between runs, eliminating test-induced thermal loading. Additionally, we typically test with extended cycle times, to judge if performance improvements or desired results require additional test time.
But not too quickly
Again, it’s critical to allow enough time between tests for the part to empty and stabilize. Test cycles without sufficient delay can leave residual pressure that impacts the fill time for the next test. It can also cause the part’s internal temperature to track down from the compression of air. You want each test cycle to be as representative as possible of a new part coming fresh off the line.
What you can now do with the waveform data
Now what can you do with the digital process signatures from those 30 or more test cycles you keep?
Let’s say your target Gage R is 20% and we find that it is already better than that at 18%. But looking at the data, we see that if we add five seconds to the test cycle to help with temperature/pressure stabilization, we can cut Gage R down to 10%. This now leaves us with a 10% window to counter the second “R” variables, like how the part is clamped test to test and other operator behaviors.
It’s now easy to play with the data for all manner of scenarios. Chart the impact of lengthening the test cycle (and adding a second parallel test station to keep up with production). Or, maintain the same overall cycle time, but change how that window is divided between the fill, stabilization and test phases. The ideal goal is to shorten cycle times while improving Gage R, as our studies are often able to accomplish.
Gage R is nothing to fear with the right approach
Manufacturers often have a love/hate relationship with their leak test, thanks in no small part to repeatability. Gage R has bubbled up as one of the biggest challenges for most people dealing with leak testing. Your leak test can be harnessed for substantial efficiency gains, cost savings and reductions in warranty claims—it just takes the right methodology and data analysis to verify the reliability and repeatability of your test equipment.
Looking for a reprint of this article?
From high-res PDFs to custom plaques, order your copy today!


