Radiography Trends Lead to High Speed CT
Today’s digital radiography is far beyond what early radiographers could have imagined.
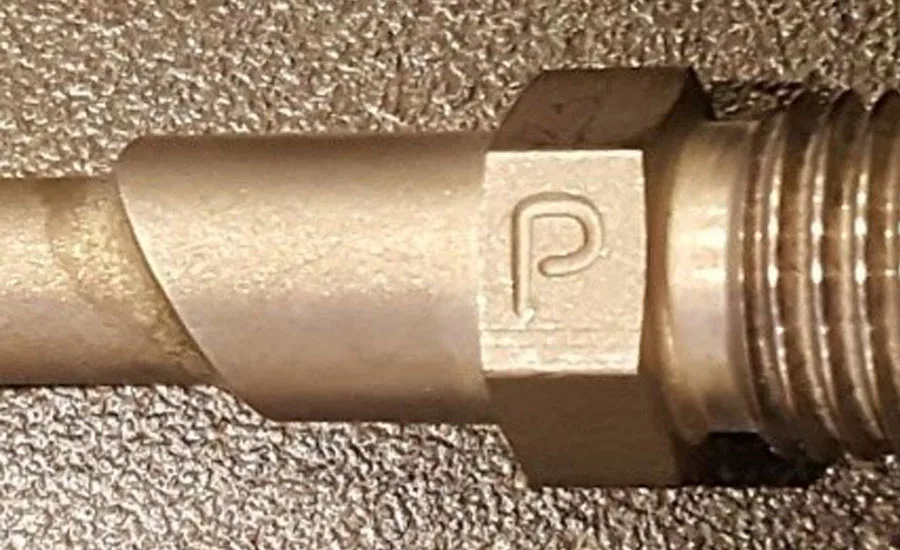
Photo of ¼” Tube Fitting Braze Joint.
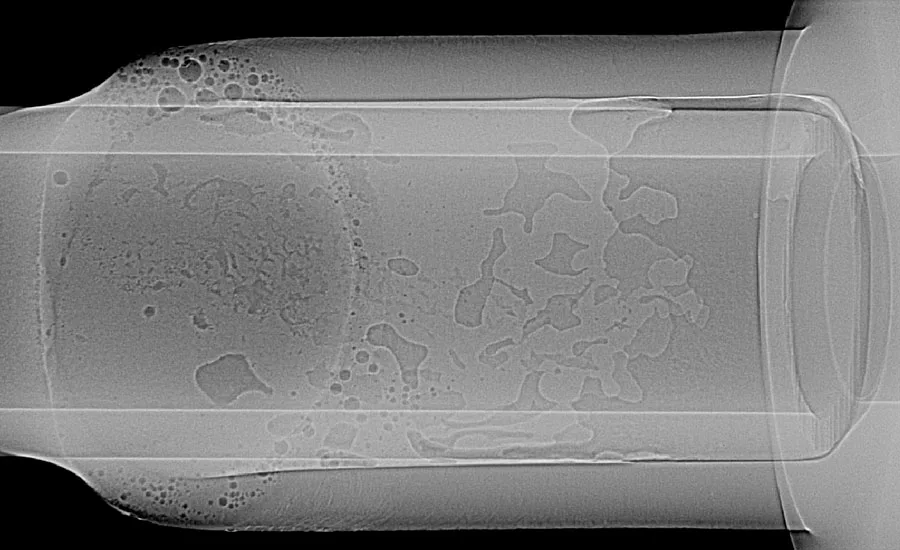
Figure 1. Superimposed DR images.
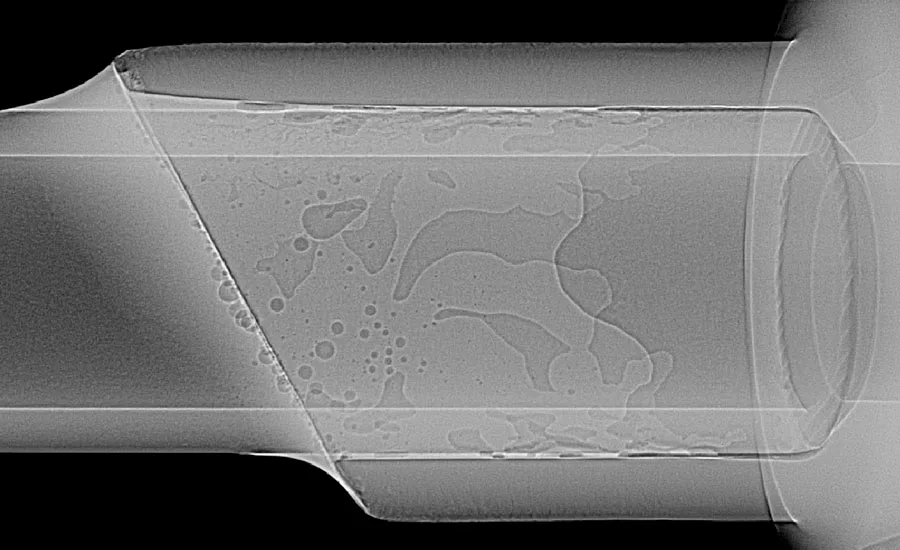
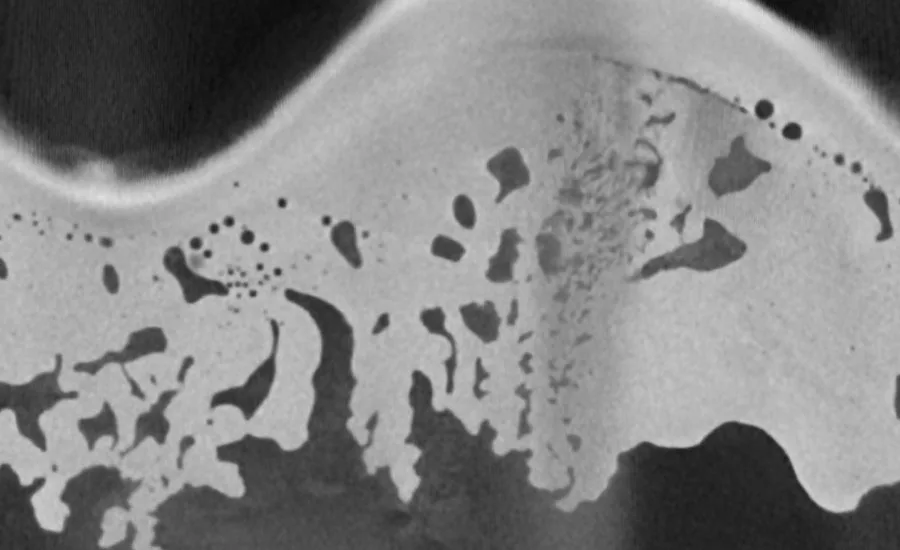
Figure 2. Rolled out CT image of braze joint.
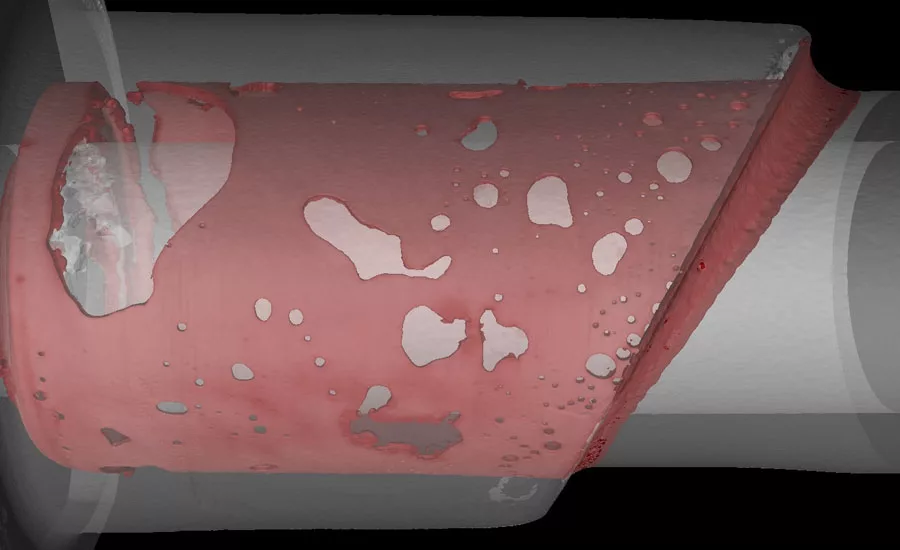
Figure 3a. CT segmentation of materials.
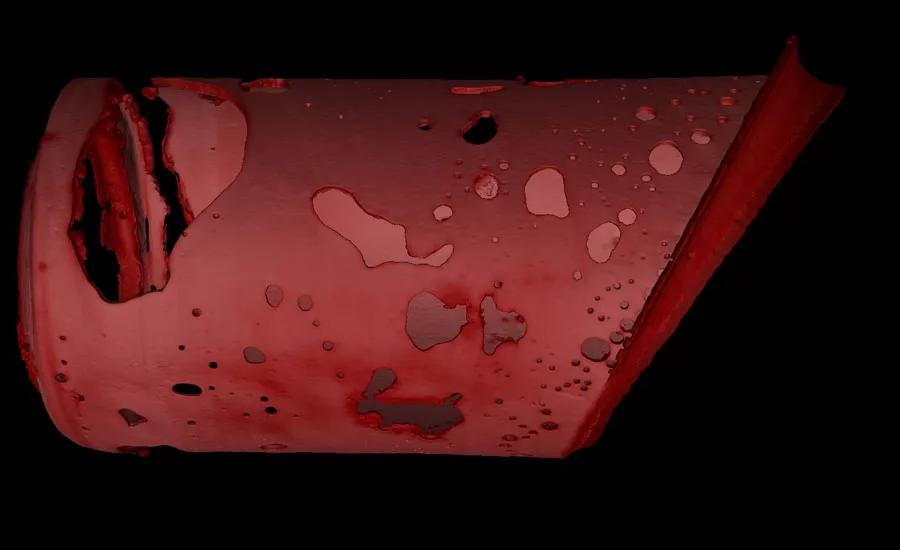
Figure 3b. CT segmentation of materials.
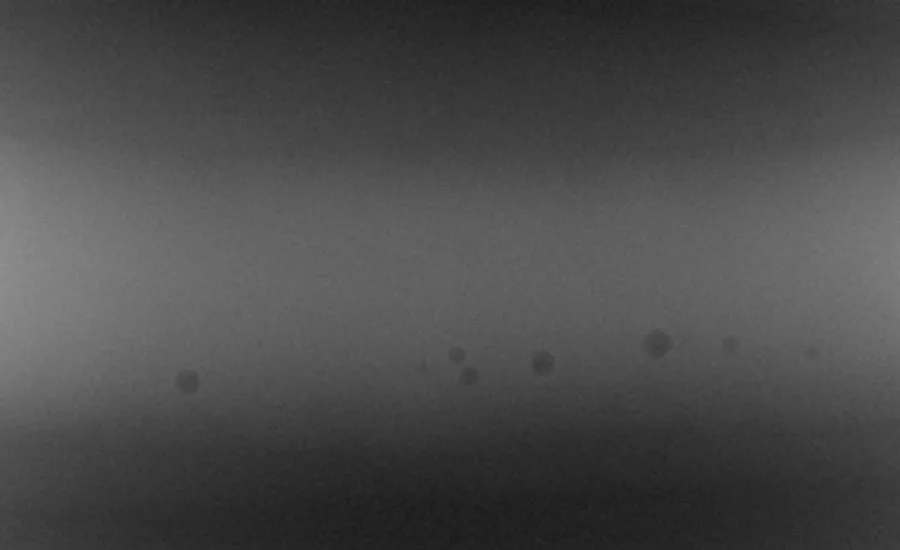
Figure 4. TI tube weld. Is porosity on nearside, far side, or both? (Also Below image: Weld Porosity Ranging from .0015” to .008”)
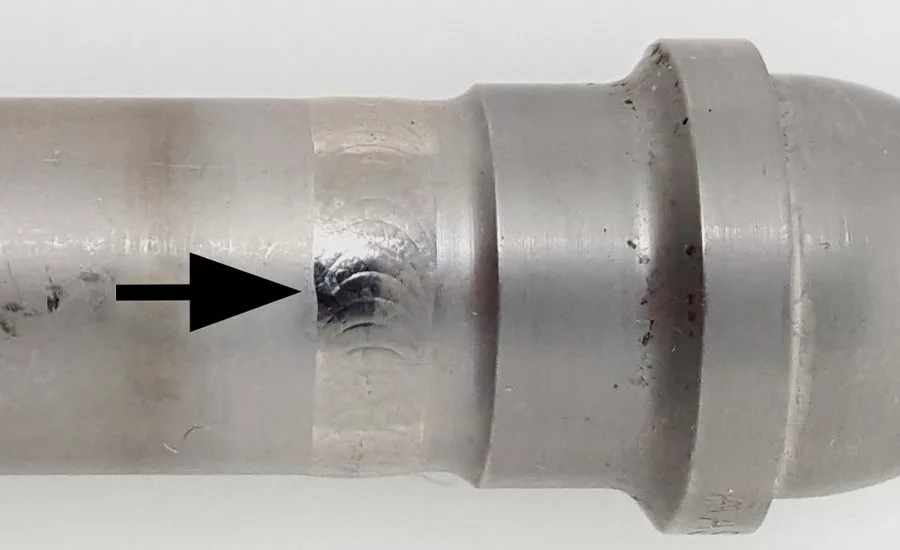
Photo of ½” Diameter TI tube weld.
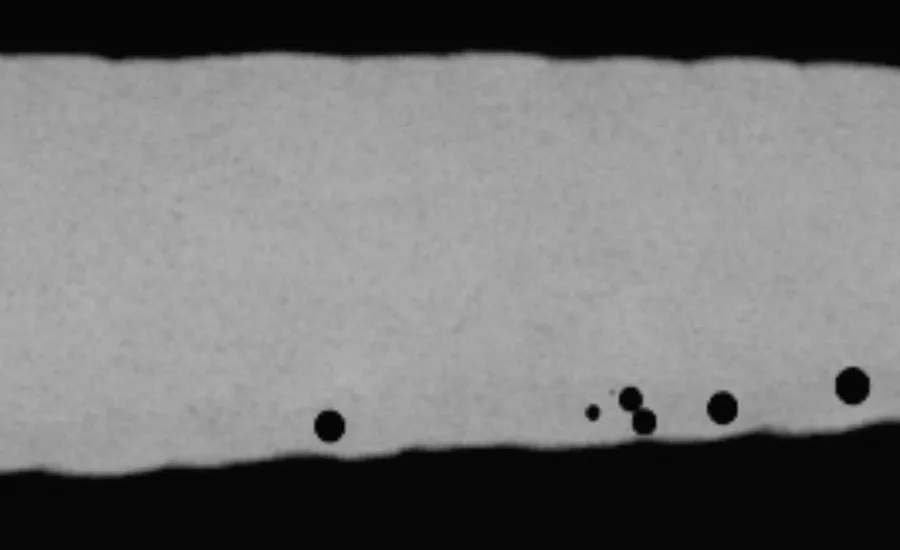
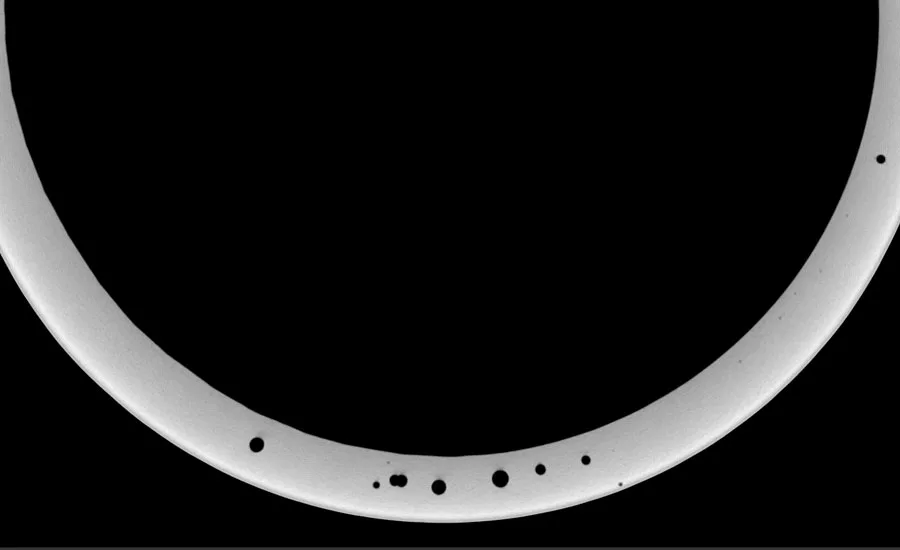
Figure 6. TI tube weld – thick slice CT
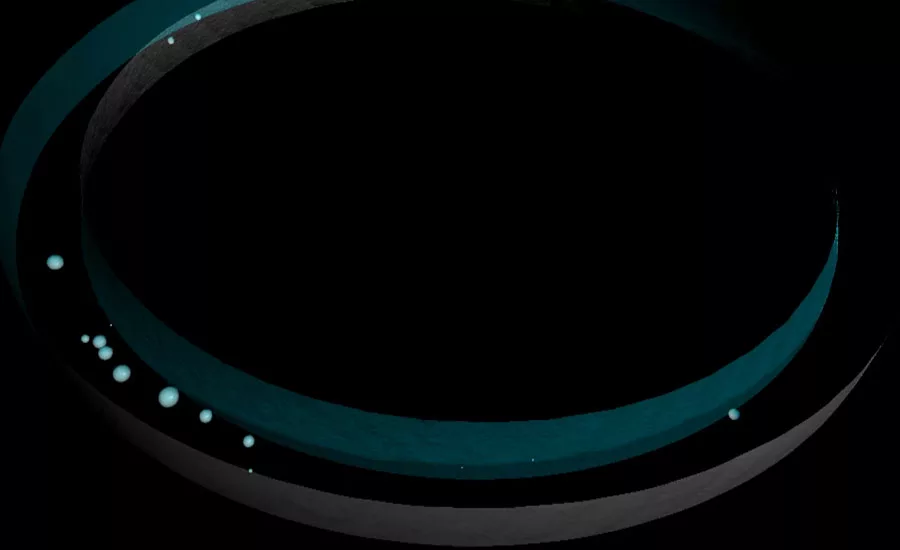
Figure 7. TI tube weld – surfaced CT view
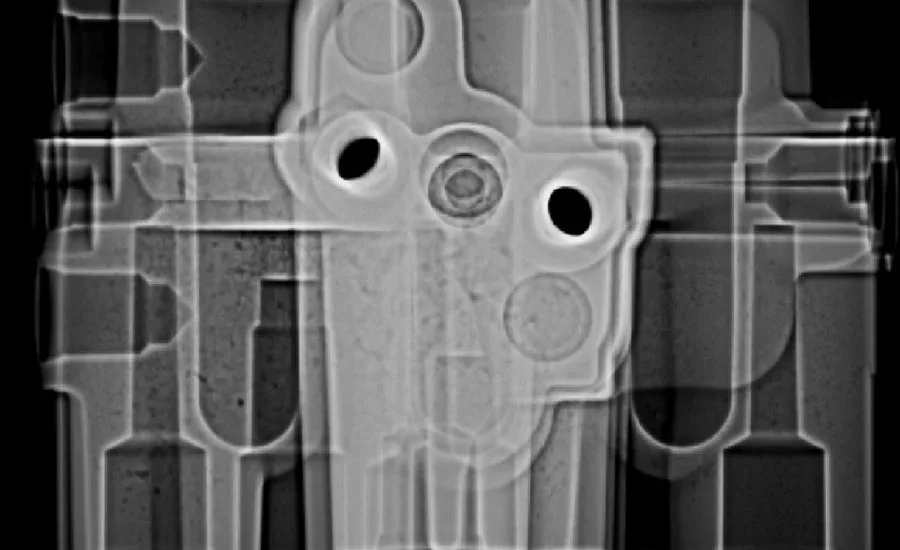
Figure 8a. Superimposed DR images
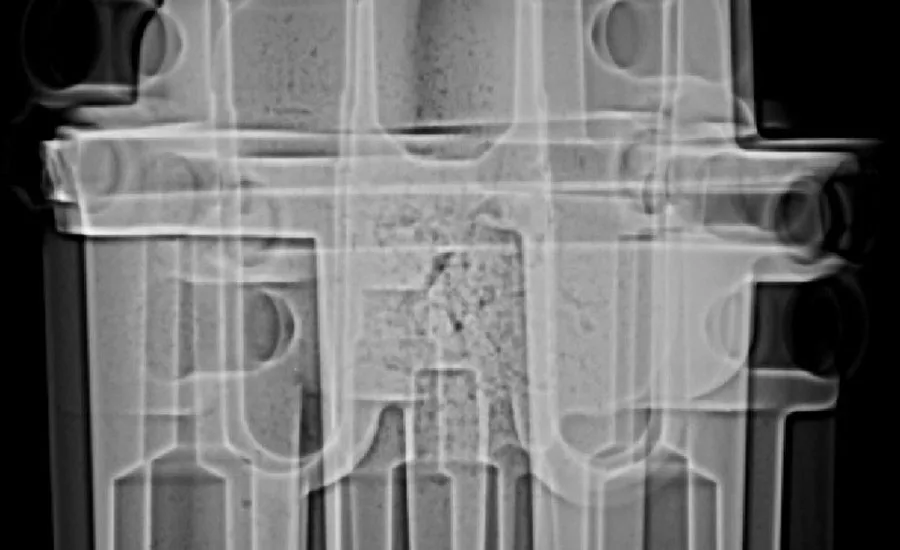
Figure 8b. Superimposed DR images
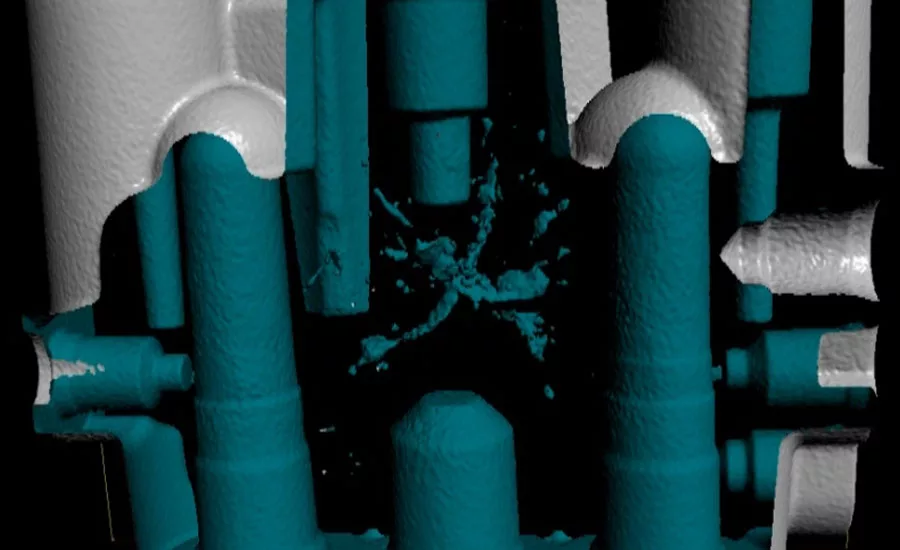
Figure 9. Surfaced CT image
For over a decade, 2D digital radiography (DR) has been aggressively replacing film radiography in applications spanning across most industries. DR image quality continues to improve with higher quality and faster speed flat panel detectors being offered. These new detectors, combined with smaller focal spot X-ray tubes and techniques employing geometric magnification, have brought the ability to produce an image quality far exceeding that of typical film radiography. Cycle times for radiographic acquisition have also been drastically reduced by using CNC controlled systems as well as robots for product and equipment positioning. All these factors combined have produced an efficiency in DR that is likely far beyond what early radiographers could have imagined. Time is money, so this has further reduced some of the cost of performing production radiography.
With the radiographic acquisition process finely tuned for production efficiency, the next area being aggressively looked at is the interpretation of the digital radiographs. Some “readers” can end up viewing and interpreting over a thousand DR images in a single shift, while others processing DR images of complex geometry products are forced to drastically slow down as the interpretation difficulty rises exponentially. For the less complex, high-volume products being evaluated, assisted or automatic defect recognition (ADR) software routines are now being aggressively considered.
For more complex products and double wall radiography, multiple 2D images are often taken to try and provide a better understanding of the dimension of indications beyond just two directions as well as the indication’s position within the product. Even with these additional static views it can still be difficult for a radiographer to separate indications that are located at two different depths within a product. This is due to the multiple indications and product features being superimposed on top of one another within a single image. This can make it very difficult to quickly make a determination of the product’s acceptance. Unfortunately, the true probability of detection of some discontinuities will often be lower, and at a minimum, interpretation times are increased along with reader fatigue. These applications as well as many others create a demand for better solutions.
The New Trend
Today’s products are designed and drawn in 3D. Finite element analysis (FEA) is performed in 3D models applying 3D discontinuities to the analysis. We also dimensionally inspect the actual product to a 3D model; however, the 3D work typically stops there. Engineers are then required to take this 3D data and create 2D acceptance criteria for radiographic inspection. The advances in DR acquisition, combined with improvements in computed tomography (CT) now provide the opportunity to perform very high-speed CT scans of many products. Production scans can now be acquired and automatically reconstructed in a matter of a few seconds to a few minutes. This provides opportunities to perform full 3D imaging of some products in less time than required for the multiple DR view acquisition process. A typical goal would be for the full acquisition and reconstruction process to be either equal, or up to 1.5 times the DR acquisition process. Any increase in acquisition time can typically be compensated for through reduced manual interpretation times when using CT. High speed CT scans can quickly provide a full 3D view of all indications as well as their location within a product. For manual interpretation, CT not only can make it easier and quicker to perform an interpretation, it also provides a more thorough evaluation netting a higher probability of detection for many types of discontinuities. With a 3D data set, automatic software routines can also be implemented with true 3D acceptance criteria applied to 3D ADR routines. CT scans not only have the ability to provide amazing 3D visualization of products, they can also provide more comprehensive 2D image slice data where 2D criteria is still being applied.
Study: DR & CT Tube Braze Joint Evaluation
Tubing Braze joint evaluation is an application where superimposed data makes 2D image interpretation difficult. See Figure 1. When two static views are provided, it can be difficult and time consuming to track the travel of multiple indications during the rotation. A miss-tracking of an indication can mean the difference between accepting or rejecting a part.
With CT, data from cylindrical products such as tubing braze joints and welds can be “unrolled” in software to produce a view of the data as if the tube had been cut and rolled out flat. (See Figure 2.) At this point, conventional 2D acceptance criteria can be applied. The obvious benefits are:
- No superimposed discontinuities
- Much faster interpretation times
- Ease of discontinuity measurement
- Better understanding of the true braze coverage
- Higher probability of detection and an accurate interpretation
Braze material and nickel tubing can be segmented and displayed together or independently. (See Figure 3.) The segmentation can be rotated providing a full 3D view of the entire braze joint. Automatic software void analysis and percentage of coverage routines can be applied based on 3D acceptance criteria.
Study: DR & CT Tubing Weld Evaluation
When imaging tubing welds, typically two to three views are captured either with elliptical techniques or straight-on views. In the later, indications located within the welds nearside wall and far side wall end up being superimposed on top of one another. When multiple discontinuities are present and the superimposed technique is applied, determining whether the indications are located on nearside, far side or both can still be difficult when viewing static images. (See Figure 4.)
- DR Requirements
- Typically, 2-3 DR views (elliptical vs superimposed)
- Typically, 2-1T IQI requirement
With CT, data from cylindrical products such as tubing welds can be “unrolled” in software to produce a view of the data as if the tube had been cut and rolled out flat. (See Figure 5.)
- Data can then be viewed with the indications throughout the entire thickness of the weld being displayed in a single view. This makes for quick interpretation when applying 2D acceptance criteria. The unrolled view in Figure 5 shows that all porosity is positioned along the one edge of the weld.
- This type of “thick slice” view can also be applied in a top down view where multiple slices are combined to provide very high contrast imaging of the entire weld width while providing information on the position of the porosity throughout the tubing wall thickness. See Figure 6.
- Figure 7 displays a full 3D surfaced view of the weld that can be rotated and manipulated for optimal viewing. The software applies surfaces to the inner and outer tubing walls along with any porosity or inclusions within the weld. The porosity therefore appears as if it is floating in space within the tubing wall. ADR void analysis tools can be applied at this time.
Study: DR & CT Aluminum Casting Evaluation
For some complex geometry castings, the product features and multiple discontinuities become superimposed on top of one another making interpretation extremely difficult even with two or three static views. (See Figure 8.)
Surfaced CT Volumes Provide high quality 3D Visualization and Automatic Void Analysis Opportunities.
Various size voids along with large cavities are clearly visible in the center of the casting. (See Figure 9.)
The probability of detection increases significantly when using 3D visualization tools. This data can also be directly compared to machining drawings using software tools to identify what discontinuities may be removed during secondary machining operations.
Summary
CT is commonly used in failure analysis, product development, and product screening but often not even considered for production environments. This is due to a perception that CT wouldn’t be able to keep up with the demanding cycle time requirements. With current technology, this simply is no longer the case in many applications. Today there are production facilities running CT systems with cycle times of five seconds or less from acquisition through ADR and reporting. Even when DR image quality produces images where indications are clearly visible, high speed CT may still be a better choice if interpretation times and reader fatigue are reduced. When it comes to detectability, for many applications if an indication is barely visible in DR it will typically be clearly visible in a CT scan at the same magnification. The contrast and detail are just that much clearer. For product having complex geometries or superimposed data, CT provides substantially more information to the interpreter and any ADR software being used. CT provides substantially more indication information relative to size and position which helps provide a more thorough evaluation. CT also improves the ability to apply 2D acceptance criteria and provided a means of applying 3D acceptance criteria. In production environments, DR and CT acquisition times can be comparable for many applications while manual CT interpretation times can be less than DR times when multiple relevant indications are present. Overall, CT should always be considered when evaluating processes and products for production applications as well as failure analysis, and process and product development.
Looking for a reprint of this article?
From high-res PDFs to custom plaques, order your copy today!


