Three Cornerstones of Smart 3D Machine Vision
Modern UI design, web-enabled 3D smart sensors, and onboard inspection software.
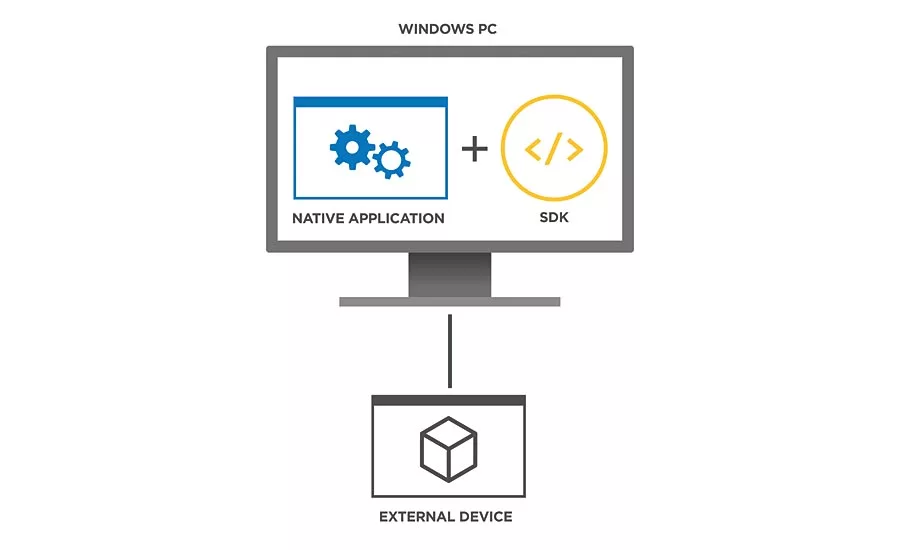
Traditional Windows Application Design
Many of today’s industrial software applications are designed to run natively on the Windows platform. Accessing and controlling external hardware devices with a Windows application is usually achieved by using a driver provided by the hardware supplier and activating hardware functions using an SDK.
The Evolution of User Interface Design
When mobile devices such as tablets and smartphones appeared, developers simply rewrote their Windows applications to compile and run on the new platforms (such as iOS and Android). Any external device support that required Windows was left behind and users were forced to go back to their desktop/laptops in order to access their legacy devices.
Today’s user expectations are much more sophisticated as a result of many new technology developments. Touch screens changed the relationship between user and application; leveraging gestures instead of mice or trackpads. Cloud storage puts data over the internet for access by any device. The cost of web-enabled technology lowered to a point where embedded devices became smart and connected, from wearables and appliances to light bulbs and thermostats.
At a consumer level, the latest IoT applications are client/server, accessing WIFI-enabled hardware seamlessly over a web browser. The industrial world, however, hasn’t quite caught on yet.
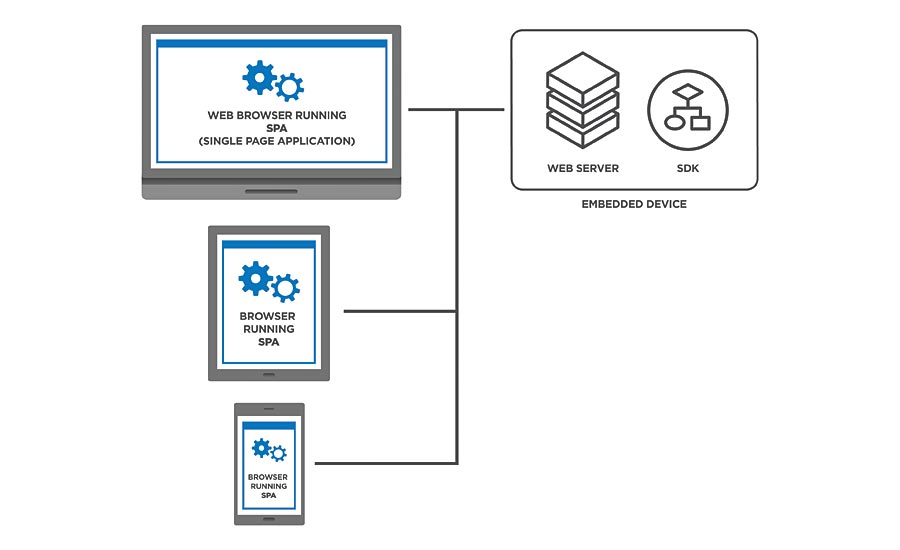
Web Server/Client Application Design
The Gap Between Consumer and Industrial Technologies
Looking at today’s machine vision development environments, most of them are running on traditional platforms, with all of the related drawbacks. While consumers are enjoying powerful new technologies, this same technology remains largely unsupported in today’s industrial environments.
Modern UI design is available to everyone, and it’s a game-changer. This design consists of a simple, single-page application running Javascript on a web browser that delivers several key benefits that are transforming the user experience: (1) client/server operation neatly separating a smart device (controller) from the user interface (view), (2) ubiquitous execution on any web browser regardless of OS, and (3) an internet aware network of interconnected and cooperating devices.
As applications become more complicated, the number of behavior-altering states and settings increases. Eventually, this becomes unmanageable unless special care is taken to ensure applications are designed for scale.
With modern web-based user interface design, application frameworks such as Angular, React, and Vue are rapidly developing to structure single-page applications with complex user components, running on-demand code when page elements are activated or when internal states change. As a result, web applications are now capable of achieving the fluidity and complexity of modern day traditional (desktop) applications, with the benefits of portability and scalability.
Modern UI Design and Web-Enabled 3D Smart Sensors
Web-enabled 3D smart sensors running embedded, full-feature 3D inspection software provide an excellent example of how single-page, dynamic modern user interface design can be used to augment production systems and improve outcomes in today’s increasingly interconnected industrial environment.
Here are just a few examples of the types of innovative UI advancements being made onboard today’s smart 3D sensors.
Diagrammatic Measurement Tool Display
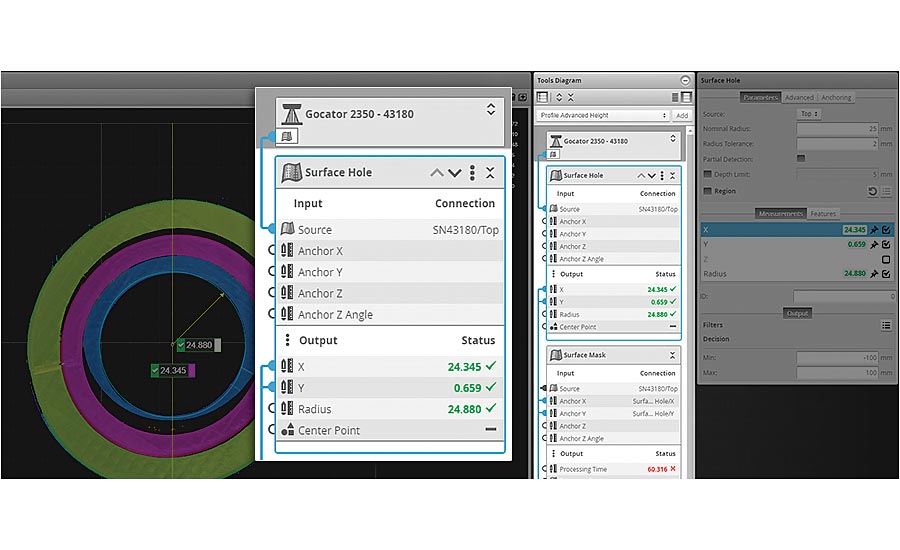
Diagrammatic display of measurement tools within a smart sensor’s UI provides the engineer with a visual representation of the data flow within a sensor system (i.e. the output from a sensor, and the input and output of tools). This particular UI design feature allows the user to create and view complex tool chains with drag-and-drop and other mouse operations, letting them implement and maintain applications demanding multiple, interconnected tools, quickly and easily.
All data types and their relationships between tools can be displayed in this type of UI architecture:
- Profile data (either directly from a sensor’s output or from tool output)
- Surface data (either directly from a sensor’s output or from tool output)
- Measurements (for use as anchors)
- Geometric features
- Tool data output (some data outputs are intended to be consumed only by SDK applications)
Multi-Measurement Data Viewing
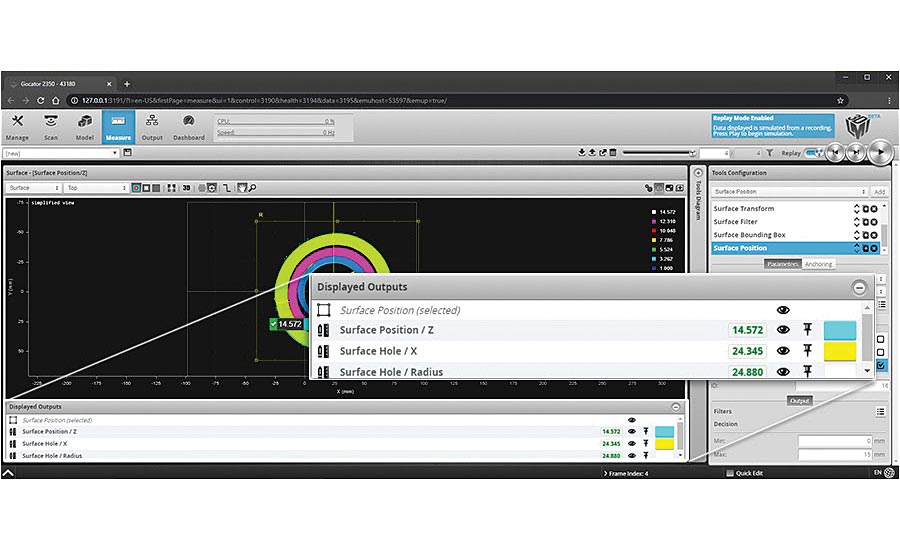
This UI design feature allows the user to pin measurements to a data viewer to see results from multiple tools simultaneously or modify a tool (e.g., a filter) and see its effect on subsequent tools in a tool chain.
The user can “pin” one or more tool outputs (measurements and geometric features) to a data viewer. When these outputs are pinned, they remain visible in a data viewer at all times, even when the user clicks on a different tool, measurement, or feature in one of the lists the web interface displays. When no tool outputs are pinned, only the currently selected tool output is displayed in the data viewer. Pin information is stored in job files, so particular monitoring or configuration setups are automatically retrieved when you load a job containing pinned outputs.
Pinning outputs is useful if the engineer wants to monitor multiple, independent measurements while the smart sensor is running in production. Pinning is also useful when setting up tools: you can change the parameters of a tool (such as a filter) earlier in a tool chain and immediately see the impact that modification has on another tool later in the chain. This minimizes toggling and clicking between tools and measurements. Pins are automatically stored as measurements in job files.
In general, multi-measurement data viewing saves the engineer time and effort by minimizing toggling and clicking between tools. Pinned measurements are even automatically stored as key measurements in your job files.
Multi-Window Data Viewing
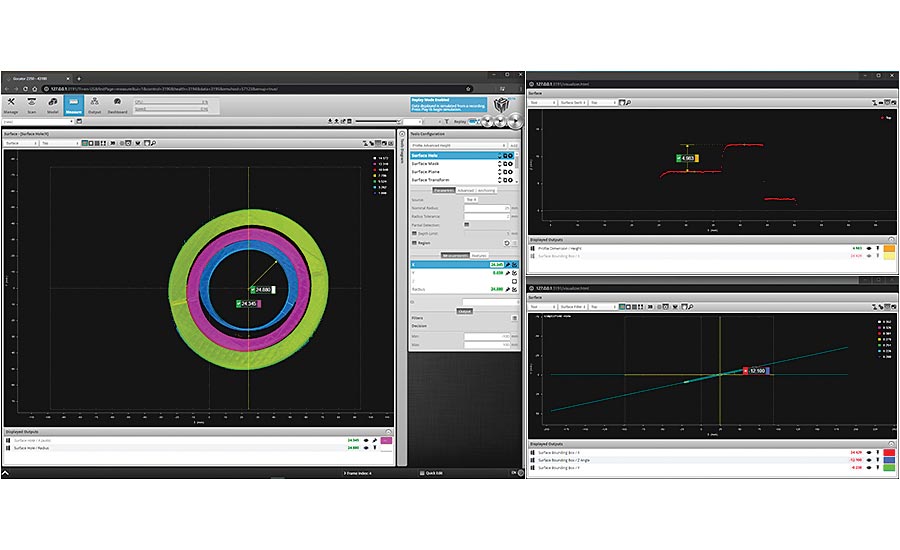
Multi-window data viewing refers to the ability to open multiple windows outside of the main browser window, containing data viewers set to different views and different sets of pinned measurement outputs. This UI design element allows the user to more easily monitor or set up complex applications—for example placing one or more data viewer windows in one computer monitor, and others in a different monitor.
Dashboard Data Viewing
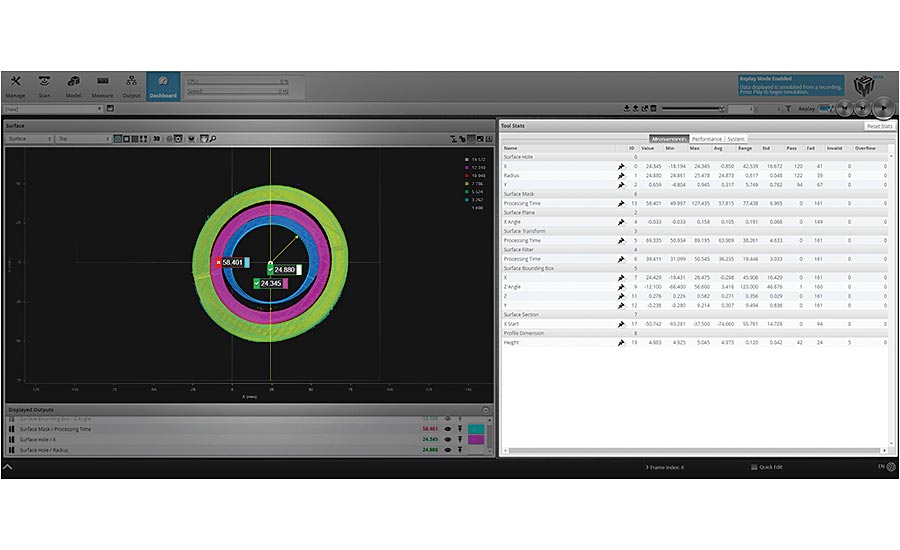
This UI design feature allows the user to view scan data directly in the sensor’s web-based dashboard. The dashboard data viewer is able to display video images, profiles, sections, surfaces, height maps, and intensity images. It is also used to configure the active area and measurement tools. The data viewer changes depending on the current operation mode and the panel that has been selected. And as already mentioned, the data viewer lets users “pin” multiple outputs (measurements and geometric features) to the data viewer.
Sensor Emulation
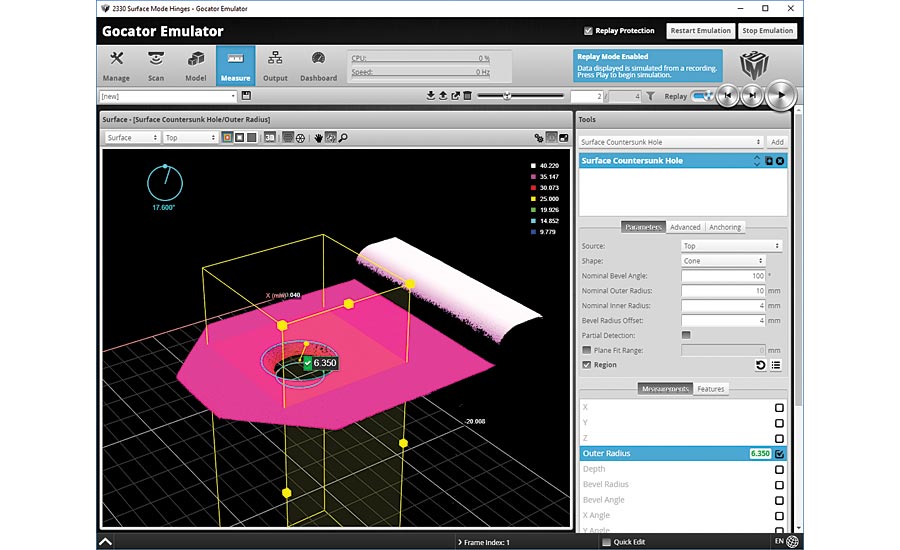
The latest 3D smart sensor software offers virtual sensor emulation for the purpose of measurement algorithm development, and sample testing without the need for a physical sensor.
Virtual sensor technology runs the full inspection software that is embedded in a real 3D smart sensor, over any web browser, with the same user interface and inspection capabilities that run on a real web-enabled 3D smart sensor. This allows engineers to explore smart features and tools, play back recorded data to test and improve inspection jobs, develop a custom user interface using the sensor SDK and simulate operation, and even develop custom measurement tools––all without having a physical sensor. The engineer can test jobs, evaluate data, and even learn more about new features, rather than take a physical device off the production line to do this. They can also use a scenario to familiarize themselves with the overall user interface if they are new to using the sensor.
Sensor Acceleration
In applications where the engineer needs to achieve greater inspection speeds (e.g. processing large data streams from multi-sensor networks), 3D smart sensor software provides the option to add sensor acceleration as either a PC application or dedicated hardware device.
In both cases, the acceleration occurs seamlessly as onboard data processing is directed from the real sensors to a PC or dedicated external hardware device. For maximum ease of use, the PC application or dedicated acceleration hardware device presents itself like a virtual 3D sensor, with the same web-based user interface as the real sensor.
This means that accelerating a 3D smart sensor is as easy as turning it on, setting up your measurement job, and switching to the preferred acceleration method in order to run the same job, only much faster. Smart acceleration quickly delivers increased memory, speed, and an efficient way to manage and process data from a multi-sensor network.
Conclusion
Web-enabled 3D smart sensors deliver a full 3D inspection software environment that leverages the advantages of single-page application design. This same web-based framework is used to deliver emulation and acceleration. The move to smart, embedded devices running web technology is capable of fully realizing the potential of IIoT (Industrial Internet of Things)—from setup, visualization, monitoring, upgrading, to peer-to-peer networking. V&S
Looking for a reprint of this article?
From high-res PDFs to custom plaques, order your copy today!


