Software & Analysis
Manual Data Entry And Its Effects On Quality
Let's look at the scary truth behind manual data entry as it relates to the calibration process.

Source: kzenon/iStock/Getty Images Plus via Getty Images
Manual data entry is still commonly used in many industrial processes even though it’s slow and labor intensive. Why? Well in short, that’s the way it’s always been done. If there isn’t another way of handling the data, this is the only option.
Let’s look at the scary truth behind manual data entry as it relates to the calibration process.
Before we dive into the quality issues that arise from manual data entry, let’s review the ways in which data is handled in industrial calibration processes.
1. Pen & Paper
Paper forms are still a very common method for capturing calibration data in the field. Later, this data is manually typed into a computer – many times by another person. This leaves two potential error risks. First, the data is written incorrectly in the field. Second, the data is transposed improperly when typed into the system.
2. Manual Entry Into A Calibration System
In some cases, calibration data is typed into either a Microsoft Excel file or a dedicated calibration software program. In order to do so, the technician must carry a laptop or mobile device into the field. This process for data entry limits the number of manual touchpoints to only one as opposed to two, like in the pen and paper process.
3. Electronic Data Storage
The fastest and most error proof method for storing calibration data. Calibration data is stored in calibration equipment electronically and then is transferred into the calibration software system. This process does not include any manual data entry steps and therefore can eliminate all the human error, making it the ideal method for quality management.
For calibrations where there are gages, indicators, displays, or similar that need to be read visually, there will still be some manual data entry. However, some calibrators have a feature to check that the data entered is within accepted values and may also have a graphical indication of the data quality for easy verification.
Now that we’ve looked at some of the ways in which calibration data is handled, let’s dive into the ugly truth behind manual data entry errors.
Typical Error Rate In Manual Data Entry Is About 1%
Based on some research, it appears that the average error rate in manual data entry is about 1%. While it is difficult to quantify that rate, we can all assume that there is an error rate associated with manual data entry. The error rate can also fluctuate if the data being entered is complicated, if the user is tired or in a hurry, or if someone simply has handwriting that is difficult to read.
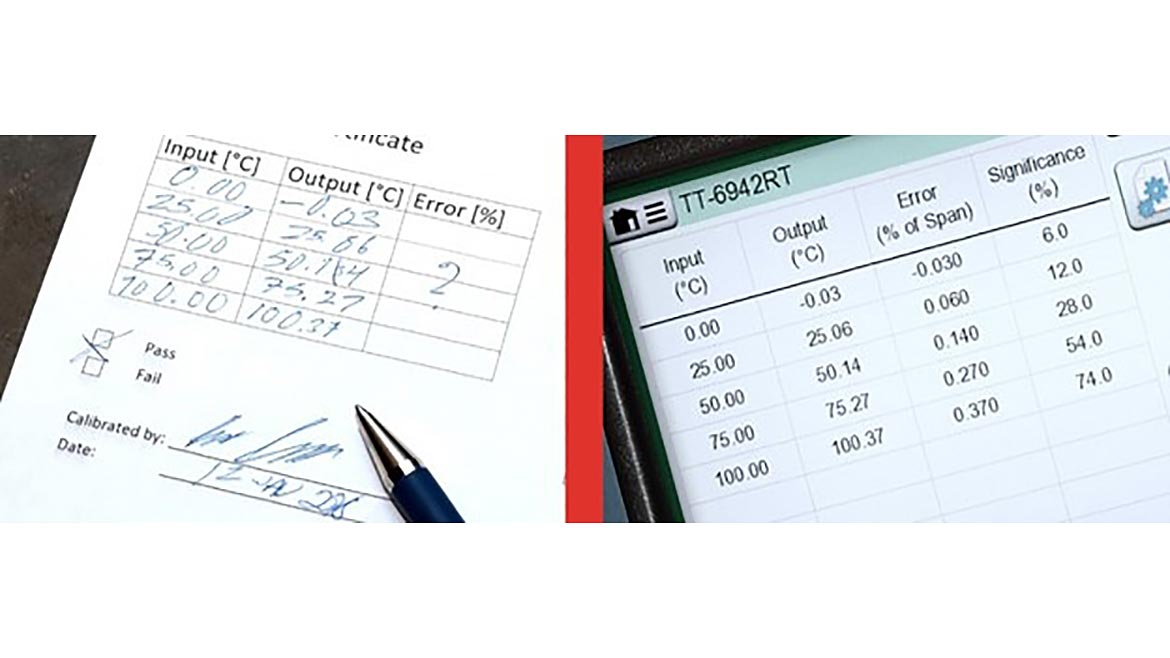
For example, in the picture on the left, we see calibration data that has been entered manually using a paper form. Some of the numbers are possibly incorrect, it is certainly not easy to read, manual error calculations have been left undone, and it is difficult to tell if that was a pass or fail. If we wanted to find out who signed off on that, it would be rather hard.
On the right side however, you can see the same calibration data on a documenting calibrator. This data is stored automatically and electronically in the calibrator’s memory, errors are calculated automatically, pass/fail is done automatically, results are sent electronically to the calibration software for storing and certificate printing, and so on. Clearly, the calibration data is more reliable.
What Does 1% Error Look Like In The Calibration Process?
First off, calibration data includes a lot of numbers, often with decimals. It is very rare to see calibration data entered as an “even number” (20mA is more likely to be 20.012 mA). In fact, seeing round numbers in calibration data is something that would cause some agencies, such as the U.S. FDA (Food and Drug Administration), to question during an audit.
Secondly, when calibrating a process instrument, such as a transmitter, the input and output data should be captured at the same time, which is difficult. If the values are drifting, additional error will be introduced if the numbers are not recorded at the same time.
And finally, in process instrument calibration, there are typically five calibration points (25% steps with 0%, 25%, 50%, 75% and 100%), and both the input and output need to be recorded. That makes 10 calibration data points. Plus, other data such as reference standards used, environmental data, date, time, etc. also must be entered.
On average, approximately 20 data points need to be entered during the calibration process. With a 1% error rate, this means every fifth calibration will include incorrect data. If one calibration includes 20 data points, then five calibrations include 100 data points. A 1% error rate means that data would be entered incorrectly once every 100 data points and therefore, every fifth calibration will include faulty data.
However, as mentioned above, in a paper-based system, calibration data is often manually entered twice. Once in the field by the technician and then again in the workshop when being entered into the system. This means that each calibration has 40 data points instead of 20, and statistically, 40 % of calibrations made will include faulty data. Told you this was ugly.
If you do manual calibration data entry using the two-phase system (written down in the field and entered manually in the workshop) about 40% of your calibration records include errors!
In a typical process site that performs 10,000 calibrations annually, all manually entered using the two-phase data entry process, statistically, they will have 4,000 calibrations with faulty data!
Now that we know the possible number of errors that can be found in manually entered data, how do we address the significance of these errors? That, of course, will depend on the situation.
If the manually entered data is wildly inaccurate, for example, if a nominal 4 mA zero point of a transmitter is entered as 40.02 mA, it will most likely be noticed at some point. But when it’s noticed, what do you do? Just move the decimal point? Repeat the calibration?
If the error is small, for example, if the transmitter’s zero point is erroneously recorded as 4.02 mA when it was actually 4.20 mA, that error may not be noticed at all. If the transmitter’s current of 4.20 mA would be out of tolerance and require correction, then entering the data as 4.02 mA will mean the transmitter passed and it will continuously measure with a too-large error.
In this worst-case scenario, data entry error will lead to a situation where a faulty calibration is being considered passed.
Now that we’ve looked at the implications of these errors and how a small 1% error rate can grow exponentially when taking into consideration the shear amount of data points required for each calibration, you may be surprised (or perhaps not) to know that manual data entry is still being used in many calibration processes, even in highly regulated industries such as pharmaceutical, food and beverage, nuclear power and many others.
As we move to a more digital world, data is becoming more important than ever. Many of the decisions we make on a day-to-day basis are based on the data we see. Data quality and integrity should be paramount to all facets of the process industry.
What if you could avoid all human errors related to manual calibration data entry?
What if, at the same time, you could make the data entry process much faster, saving time?
What, you may ask, would be the cost for such a system? Can you afford it?
In return I would ask, what are the costs of all the errors in your calibration data? What would be the value of such a system to you? Can you afford to be without it?
There must be a better way.
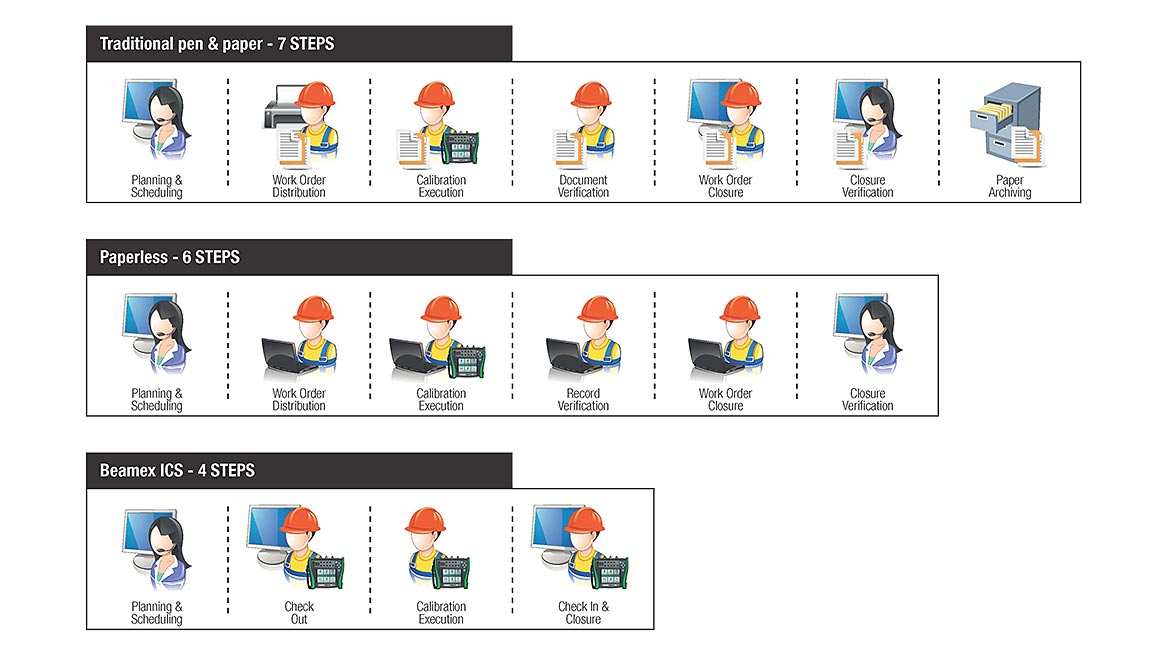
Click on the image to enlarge.
With an integrated calibration solution, you can replace manually entering calibration data with the most highly automated calibration data collection on the market.
In a nutshell, an integrated calibration system comprises calibration software, documenting calibrators, and mobile data-entry devices communicating seamlessly. Also, the calibration software can be integrated with your maintenance management system (CMMS) to enable a paperless automated flow of calibration work orders from the CMMS to the calibration software and acknowledgement of the work done from the calibration software to the CMMS.
Looking for a reprint of this article?
From high-res PDFs to custom plaques, order your copy today!


