Is Your Total Cost of Quality Picture Complete?
While quality influences many business functions, its full impact often remains unseen

Image Source: iStock
A study by Gartner reveals that only 23% of manufacturers actively track the Total Cost of Quality (TCOQ). And even among those who do, most prioritize failure costs (44%), neglecting the costs associated with achieving good quality. Without a clear picture of the full impact of quality, leadership support can dwindle while investments often stall. This reinforces the misconception of quality as a peripheral function, hindering its ability to truly mature within an organization.
But why is it so difficult to track the full impact of quality? It’s largely because with quality, there are many invisible costs. The iceberg metaphor is the perfect representation of these – surface costs, such as rework are apparent and visible to everyone. But, beneath the surface lurks a far greater mass: the invisible costs associated with achieving good quality. These hidden expenses, like the extra energy used during rework or the accelerated wear and tear on your equipment and machines, often go unnoticed. Yet, they can represent the biggest chunk of your Total Cost of Quality (TCOQ).
This article shows how to make leadership aware of all costs and not just the tangible ones. It helps quality professionals to quantify the Total Cost of Quality and derive a compelling business case from that quantification.
Making the relevance of quality crystal clear
A thriving culture of quality hinges on leadership commitment. Yet, in many organizations, leadership may not grasp the full impact of quality management. This often results in immature quality practices and a reactive approach, relying on individual efforts rather than proactive and systemic strategies. Without leadership support, quality professionals face hurdles in improving operations, as investment proposals may be rejected. To address this, initiating conversations with leadership about the value of quality management is crucial, as it’s where true change needs to take root.
Securing executive buy-in for quality initiatives necessitates quantifying their impact and deriving a business case from that quantification. A well-defined business case translating improvements into measurable results and demonstrating a positive ROI strengthens the argument for quality investments and makes your value proposition crystal clear. Leadership, focused on maximizing value, is unlikely to ignore a clear opportunity to improve performance. A data-driven approach that showcases quality’s contribution to the bottom line is key to securing leadership buy-in. This starts with understanding and measuring the Total Cost of Quality.
Invisible costs and the hidden factory
To measure the Total Cost of Quality (TCOQ), adding up the visible costs is not sufficient. As illustrated with the iceberg metaphor above, there is much more going on in the cost of quality than what you might see at first glance. When you’re pitching the importance of quality investments to leadership, it’s important to paint the whole picture. They need to be aware of all the costs and not only of the tangible, physical ones that may surface in Excel sheets.
A simple, yet effective way to classify costs, including the invisible ones, is using Val Feigenbaum’s PAF (Prevention, Appraisal, Failure) methodology. Part of Feigenbaum’s Total Quality Management concept, this framework breaks down costs based on quality outcomes - Good Quality and Poor quality. Good Quality costs fall under Prevention and Appraisal while Poor Quality costs are split into Internal Failure and External Failure. More specifically:
- Prevention costs are proactive measures taken to avoid issues from the start. These include expenses like audits and employee training.
- Appraisal costs involve activities that ensure quality. Examples include quality control inspections and equipment calibrations.
The difference between internal failures and external failures tells us where in the production process a problem arose. This difference may seem small but it’s in fact very significant since the monetary impact increases drastically in every step of the supply chain. As such:
- Internal failures are identified before the product reaches the customer. This could include anything from needing to rework or scrap a product to incurring costs for corrective actions and disposal.
- On the other hand, external failures occur after the product reaches the customer, leading to expenses like return shipping and product recalls.
Another way to put costs into perspective is using Feigenbaum’s hidden factory metaphor. You could imagine this as your factory’s evil twin, producing only defective products. Should your Poor Quality costs amount to 10%, then that would mean that 10% of your annual revenue, 10% of your salaries, 10% of your investments are going in this hidden factory that’s delivering nothing but problems.
The cost of quality value chain shows how this money is wasted. Raw materials, labor, and energy are poured into the production process, but due to poor quality, a significant portion ends up as scrap or rework, further draining resources. This highlights the critical role of prevention and appraisal activities – they act as safeguards against this hidden factory, ensuring your resources flow towards producing good quality products and generating revenue. In contrast, a mature quality operation brings several benefits with the two main ones being: increased efficiency through time savings, and the fostering of a strong culture of quality. A mature quality operation not only strengthens your company’s short- and long-term success but also becomes a clear value proposition for leadership.
Building the business case for quality management
Having divided our quality management activities according to the PAF model it becomes much easier to quantify them and reveal their impact. A survey by Gartner looked at how the four buckets of the Feigenbaum model were distributed across the industry: 27% for internal failures (mistakes caught before reaching the customer), 20% for external failures (mistakes reaching the customer), 22% for prevention (proactive measures to avoid issues), and 32% for appraisal (activities ensuring quality). This distribution, with roughly half dedicated to good quality (prevention and appraisal) and half to poor quality (internal and external failures), can serve as a benchmark if you lack data from your own operations. It helps estimate your cost of quality and its internal allocation.
The study also found that the average cost of quality hovered around 5% of annual revenue. For a typical manufacturer with $50 million in revenue, this translates to a total cost of quality exceeding $2.5 million. This cost can be further broken down into the four categories mentioned earlier: prevention, appraisal, internal failures, and external failures.
Manufacturers often shy away from the full Cost of Quality picture because gathering precise data can seem daunting. While replacing faulty goods or handling claims is straightforward, hidden costs like lost production from rework or higher energy use are trickier to track. Quantifying preventive actions like risk assessments takes effort too.
But it doesn’t have to be a data labyrinth! Using reasonable assumptions for individual activity costs, we can leverage the PAF model framework. By assigning standard unit prices (e.g., per risk assessment, complaint, or audit), multiplying them by the number of activities, we get a ballpark cost for each category and the overall picture. While estimating unit prices requires some legwork, the result can be a surprisingly accurate model.
To build a compelling case, industry benchmarks offer a great way to assign monetary values to each cost of quality category.
Simplifying Cost of Quality calculations
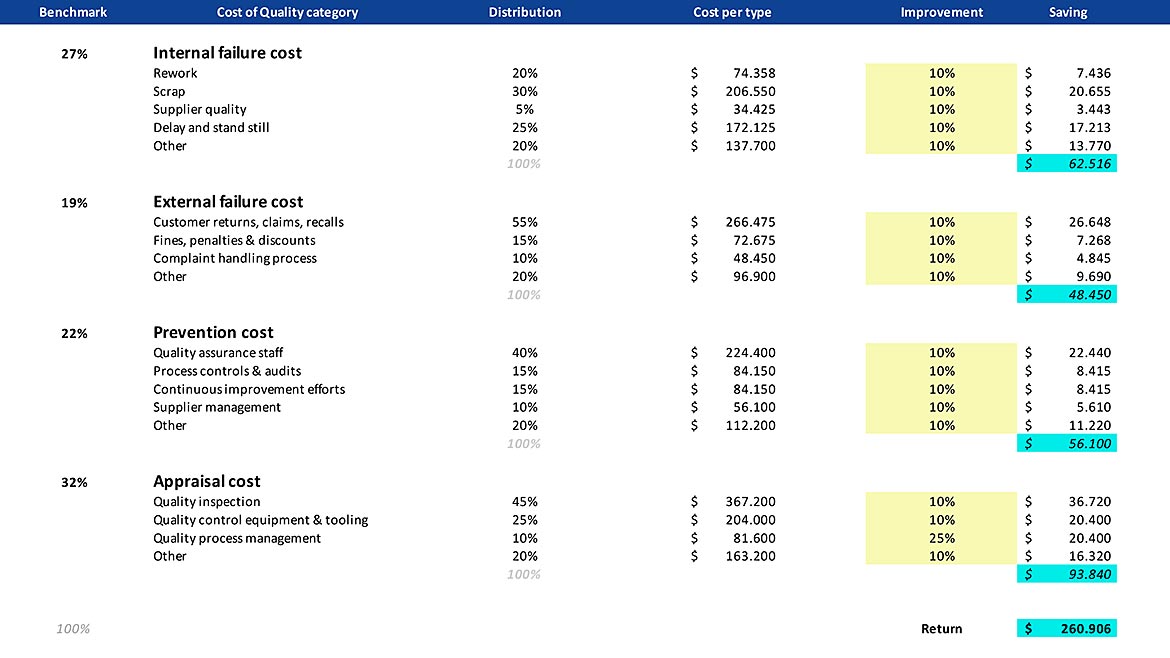
For a practical approach to cost calculation, an ROI calculator empowers the assessment of quality improvement initiatives. It also allows to leverage industry benchmarks and group quality activities based on the PAF model.
Instead of complex data entry, users simply input their annual revenue and expected cost reduction per relevant area. They then enter the anticipated quality improvement percentage per area, and the calculator provides an ROI figure (see the figure below).
Built on the PAF model, the calculator covers all aspects of quality management, making it universally applicable. Whether it’s enhanced testing, advanced risk management, or a dedicated customer complaints system, this tool helps assess the financial impact.
Best practices on building the business case
So, how can you paint a complete picture of quality? To make your business case more compelling, keep in mind these best practices:
- Don’t share plain numbers, always put them in context and add examples.
- For instance, you can refer to a quality incident that may have escalated all the way to the boardroom and you can demonstrate how the improvement project you proposed could have prevented this, limited its impact or detected its occurrence earlier. This puts it into perspective and makes it easier for leadership to see its relevance.
- Don’t obsess over accuracy, overall dynamics are the key.
At first, quantifying may seem difficult. But that should not stop you from showing overall dynamics. For instance, you could use a shirt size approach where you have small, medium, large to classify your complaints according to their impact. Then, you can move a step further and assign standard prices. - Explain the value chain of Quality Management.
If they don’t understand the value chain, they will also not understand the fundamental value and relevance of quality management for the entire business. As such, it’s important to clarify how investing in quality management will affect the baseline and the top line of the business – focus on creating the bigger picture and highlighting dynamics rather than on the accuracy of numbers.
For a webinar on this topic, visit https://alisqi.webinargeek.com/good-quality-is-good-business?cst=Quality-Magazine-your-total-cost-of-quality-complete.
For more about the company, visit www.alisqi.com/
Looking for a reprint of this article?
From high-res PDFs to custom plaques, order your copy today!


