Management
Learning to See the Quality Stream
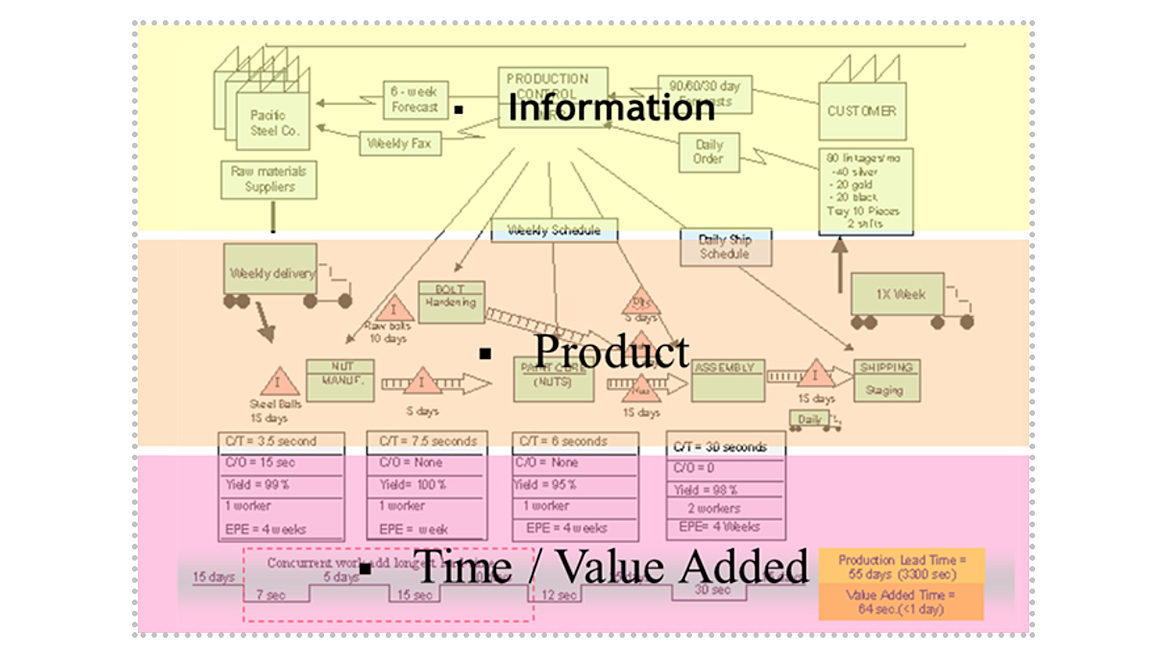
By creating the value stream map and overlaying each quality process, we were able to see missing data, key constraints, balance of labor, waste in each process and time constraints.

Are you making decisions based on “Big Picture Data” or rather “Who Yells the Loudest”?
As a leader, we can often become distracted by fighting the fires of daily management.
Great leaders take the time to collect data and see the big picture in order to focus on the biggest constraint, opportunity, or gap. Never become distracted by those yelling the loudest. Focus your actions on data. One of my favorite quotes is, “In God I trust, all others bring data!” It may very well be true that the squeaky wheel should get the grease but there may be bigger problems to address first. To see the big picture for Quality, try using a lean tool that I call quality stream mapping.
If a quality auditor came and audited your facility, they would be amazed if they could see your entire quality system from supplier to customer on one wall or in one big picture view. Details and systematic improvement could then easily be seen and assessed for planned actions. Quality stream mapping can help any organization.
Critical thinking connects big picture thinking with logical ideas.
When making decisions, we must look at the big picture, understand the current state with data, and form priorities of focus. Leaders must develop critical thinking skills that help drive through the noise or drama and see the most beneficial actions based on the big picture for the company.
Where should you begin? Start with a Foundational Value Stream Map
Value Stream Map Definition: All the activities (both value-added and non-value added) required within an organization to deliver a specific product or service.
“Everything that goes into” creating and delivering the “value” to the end-customer.
I see value stream mapping as a multi layered, 3D spider web that connects everything in the company. Most people do a high-level value stream map that shows: product or service flow, communication flow, and key time and value-added data to identify constraints and opportunities.
I agree that this is a great first step, but this article may help you understand the true connectivity that a value stream map can give your organization.
What are the benefits of Value Stream mapping?
Value stream mapping helps you:
- Visualize more than a single process
- See the sources of waste
- Provide a common language
- Make decisions about visible flow
- Show the linkage between information and material flow
After you create a foundational value stream map with the current state, opportunities for improvement, future state map, and improvement plan, you are ready to take the foundation to the next level.
Next Overlay Key Systems on Top of your Value Stream Map
Back in the day, we used overhead projectors instead of Power Point.
We would lay down sheets of plastic on the light lamp and it would project anything written on the clear sheet on the wall. You could also lay a sheet on top of another sheet and layer information to project it on the wall. Think about this layering in terms of a value stream map. After you have completed a foundational value stream map overlay key systems on top of the value stream map.

Overlay your Quality System on Top of your Value Stream Map
Derived from the value stream map, a quality stream map can be used to represent the entire quality stream (enterprise wide). A quality stream includes all quality control actions that occur to a given product from its inception as a raw material through delivery to the end customer. Our focus will be primarily from supplier final inspection to customer incoming inspection.
I started quality stream mapping over 15 years ago to improve my supplier’s quality yield for CPAP motors. We wanted to see the big picture for quality and understand what key actions were needed based on data throughout multiple quality processes. By creating the value stream map at the supplier and overlaying each quality process, we were able to see missing data, key constraints, balance of labor, waste in each process and time constraints. We created a focused plan and drove problems out of the entire system.
This was a great way to visualize the entire quality system for a total view of all processes. Think about if your ISO inspector came and saw the entire plants quality system blown up and displayed on the wall. Details and systematic improvement could then easily be assessed. Inspections such as receiving inspection, in process inspection and final inspection could be seen.
Visualization of quality information flow such as quality alerts, non-con reporting, return information flow and defect reporting are just some of the things to display and learn from on the quality stream map. All the templates used in quality were also displayed on one wall around the associated areas of the map. By doing this we were able to see redundant information without value and create standards. Critical to quality product points were also identified for suppliers and communicated from to us from customers.
This is a quality stream map data collection Check list detailing the areas and data that should be collected for the big picture view.
Quality Stream Map – Data Collection Checklist
|
|
|
|
|
|
||||
|
|
Design Quality Elements and Systems |
|
||||||
|
|
Phase Gate Process Verified |
|
||||||
|
|
DFM - Design for Manufacturing |
|
||||||
|
|
FMEA - Design and Process Failure Mode Effect Analysis |
|
||||||
|
l |
Quality Product Plan Created |
|
||||||
|
|
Product Requirement Matrix from Marketing Requirement Spec and Design Goals Spec. |
|||||||
|
|
Summary of Regulatory Controls Requirement |
|
||||||
|
|
Engineering Change Order during Design Process |
|
||||||
|
|
Life Test Action Items from Findings |
|
||||||
|
|
Environmental Test Action Items from Findings |
|
||||||
|
|
|
|
|
|
||||
|
|
Purchasing and Suppliers |
|
||||||
|
|
Approved Supplier Process - Verify Approved Suppliers on Product |
|
||||||
|
|
Supplier Audit System |
|
||||||
|
|
Supplier Scorecard System |
|
||||||
|
|
Supplier Corrective Action Reporting System |
|
||||||
|
|
Traceability of Parts Information |
|
||||||
|
|
Supplier Guidebook |
|
|
|||||
|
|
Supplier Change Notification Process |
|
||||||
|
|
|
|
|
|
||||
|
|
Production |
|
|
|||||
|
|
Standard Work Verification and Update |
|
||||||
|
|
Cross Training Verification and Update |
|
||||||
|
|
Critical to Quality Points of the Product |
|
||||||
|
|
Utility - Water, Air, Controls and Risk |
|
||||||
|
|
Traveler standard work and Call outs |
|
||||||
|
|
ECO - Engineering Control Order System |
|
||||||
|
|
Software Revision Control - Verify current Revision in process |
|
||||||
|
|
Customer Supplied Product - Control System |
|
||||||
|
|
Scrap Information |
|
|
|||||
|
|
Visual Final Inspection |
|
||||||
|
|
Rework Process and Standard Work - Findings |
|
||||||
|
|
|
|
|
|
||||
|
|
Shipping and Customer |
|
||||||
|
|
Shipping Damage - RMA - Return Material Authorization |
|
||||||
|
|
Customer RMA - Findings |
|
||||||
|
|
Replacement Process for Damage |
|
||||||
|
|
Evaluation from Customer Process - Corrective Action System - Escalation |
|||||||
|
|
Customer Satisfaction Process |
|
||||||
|
|
|
|
|
|
||||
|
|
Inspections |
|
|
|||||
|
|
Supplier Inspections |
|
||||||
|
|
Incoming Inspections |
|
||||||
|
|
Internal Supplier Inspections |
|
||||||
|
|
Production Inspections |
|
||||||
|
|
Production Audits |
|
|
|||||
|
|
Lot Inspection Audits |
|
||||||
|
|
Visual Inspection |
|
|
|||||
|
|
Customer Inspections |
|
||||||
|
|
|
|
|
|
||||
|
|
Systems |
|
|
|||||
|
|
Non-Conformance System Supplier |
|
||||||
|
|
Non-Conformance System Production |
|
||||||
|
|
Non-Conformance System Customer |
|
||||||
|
|
Calibration Control System |
|
||||||
|
|
Corrective Action / Root Cause Counter Measure System |
|
||||||
|
|
Preventative Maintenance System |
|
||||||
|
|
|
|
|
|
||||
|
|
Key Deliverables |
|
|
|
||||
|
|
Value Stream Map |
|
|
|||||
|
|
Quality Stream Map |
|
|
|||||
|
|
Pictorial VSM |
|
|
|||||
|
|
Plant Flow of VSM |
|
|
|||||
|
|
Metrics from each Area of VSM |
|
||||||
|
|
Gap Analysis |
|
|
|||||
|
|
Transformation Plan |
|
||||||
|
|
|
|
|
|
|
|
|
|
Link Other Key Information to your Value Stream Map
Think of a value stream map as a spiderweb that connects key information to ensure that it is present and updated. Another great unknown function of value stream mapping is linkage to critical information. You can link anything important to the associated area of a value stream map. By linking information, it makes it very easy to see what you have, what you are missing and what you need to update.
Information that I link to Value Stream Maps:
- Standard Operating Procedures
- Work Instructions
- Standard Work
- Templates
- Process Maps
- Department Playbooks
Time to Get to Work
Just like a good garden needs constant tending, your value stream and quality stream need continuous improvement. It’s a journey, not a destination. You must keep asking those tough questions, dig for root causes, and never settle for good enough.
No better time for action using value stream mapping and quality stream mapping than now! You have a much better chance of creating a great annual improvement plan if you have a value stream map, a quality stream map and a linked value stream map. Improve the way you improve. Seeing the big picture will set you up for success!
Looking for a reprint of this article?
From high-res PDFs to custom plaques, order your copy today!


