Quality Magazine logo
search
cart
facebook twitter linkedin youtube
  • Sign In
  • Create Account
  • Sign Out
  • My Account
Quality Magazine logo
  • NEWS
  • PRODUCTS
    • FEATURED PRODUCTS
    • SUBMIT YOUR PRODUCT
  • CHANNELS
    • AUTOMATION
    • MANAGEMENT
    • MEASUREMENT
    • NDT
    • QUALITY 101
    • SOFTWARE
    • TEST & INSPECTION
    • VISION & SENSORS
  • MARKETS
    • AEROSPACE
    • AUTOMOTIVE
    • ENERGY
    • GREEN MANUFACTURING
    • MEDICAL
  • MEDIA
    • A WORD ON QUALITY PUZZLE
    • EBOOK
    • PODCASTS
    • VIDEOS
    • WEBINARS
  • EVENTS
    • EVENT CALENDAR
    • IMTS
  • DIRECTORIES
    • BUYERS GUIDE >
      • Supplier Insights
    • NDT SOURCEBOOK
    • VISION & SENSORS
    • TAKE A TOUR
  • INFOCENTERS
    • Digital Quality Management Systems
    • NEXT GENERATION SPC & QUALITY ANALYTICS
  • AWARDS
    • ROOKIE OF THE YEAR
    • PLANT OF THE YEAR
    • PROFESSIONAL OF THE YEAR
  • MORE
    • Expert Columns
    • NEWSLETTERS
    • QUALITY STORE
    • INDUSTRY LINKS
    • SPONSOR INSIGHTS
  • EMAG
    • eMAGAZINE
    • ARCHIVES
    • CONTACT
    • ADVERTISE
  • SIGN UP!
Measurement

Measurement

Why Measurement System Analysis Student Capstone Projects Lead to Lasting Benefits

In Search of Trustworthy Data

By Tracy Owens
Firefly magnifying glass on a circuit board.
Image Source: Generative AI image created via Adobe Firefly
July 28, 2025
✕
Image in modal.

Over the last few years, students in our capstone program at Ohio State have led some very successful projects with a wide variety of sponsoring organizations. Projects in manufacturing, service, healthcare, not-for-profit, and educational settings have produced win-win outcomes. The sponsors are helping to reinforce students’ learning in live environments, and students are driving positive changes for their sponsors. Each project has its distinguishing features, as no two projects are exactly alike, and the use of data to diagnose problems and to drive decisions is an important feature in all of them.

One technique that I strongly urge all students to deploy is measurement system analysis (MSA), which is the assessment of how the operators measure their work. This is not the same as the all-important concept of how operators perform their work, which is commonly what we are trying to improve. These studies are important because a process or system is easier to understand and improve if we know that we are using accurate data. The reason I insist that students conduct an MSA is so that they will have the confidence to challenge data after graduation, and the skill to lead a study of data integrity.

As an example of unreliable data in the workplace, suppose that you ask one operator whether a work order is complete and ready for action, and that operator expresses that it is ready. Then you ask a second operator about the same work order, and that person states that the work order is incomplete. This mismatch reveals an inconsistency in the way the process is being measured, not necessarily the way the work is being done. At this stage, we are not asking about job performance.

READ MORE

  • Why It's Important to Read Speaker Reviews

During the early phases of a project, what might be considered the Measure phase in the popular DMAIC framework, the MSA is conducted so that the project team can be confident that all operators are measuring the process consistently. The setup of an MSA is deliberate. It must be challenging enough to reveal inconsistencies, while not being unrealistic. In other words, the MSA must be built to reflect the expected range of conditions that the operators will typically experience while doing the work.

MSA Setup

In this section I will describe a practical application of MSA. The deeper statistical calculations will not be shared, as my focus is on setting up a project-based study and using the results to help the organization make better decisions. A good MSA will present operators with opportunities to measure a significant aspect of their work accurately. There are three types of mismatches we are trying to uncover in an MSA:

  • Repeatability is the ability for one operator to measure something exactly the same way more than once. If we ask an operator to measure the outside diameter of a pipe or to evaluate the completeness of an information packet, and then we ask them to evaluate the same item again, will they record the exact same result?
  • Reproducibility is the ability for two or more operators to evaluate the same item consistently.
  • Accuracy is the ability of any operator to record the correct measurement and not err or evaluate the item incorrectly.

I always encourage the students and their project teams to select actual items from recent history to include in the MSA. For example, if the operators are going to evaluate inbound goods in a retail warehouse to determine whether they are assembled correctly, we will request recent items that successfully passed such an inspection as well as items that failed.

An MSA textbook will recommend that you use 10 different items and three operators, and that you ask the operators to evaluate every part two times each. My suggestion, in general, is to use nine or 12 parts for the study. One third of those parts should have a defect that is easy to identify, one third of them should have a defect that is tricky to identify, and one third should not have any defects at all. The reason for the clean parts is to detect false positives, times when the operator might fail a part that was actually acceptable. To help the operators forget how they scored each item in round one, the coordinator must allow sufficient time before round two.

Figure 1: Setting up a measurement study
Figure 1: Setting up a measurement study. Source: Tracy Owens

MSA Results

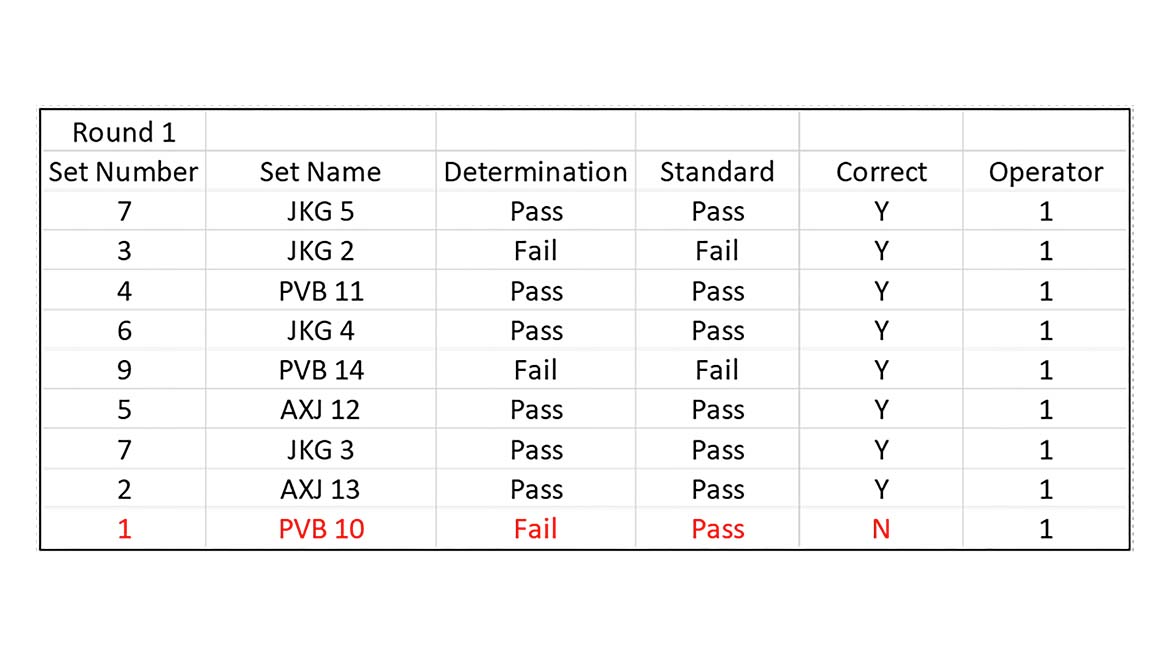
After all operators have evaluated all parts twice, it is time to conduct the analysis and learn how well the measurement system is working today. In a pass/fail study, like the completeness of a work order or information packet, there will be three numeric methods for evaluating repeatability, reproducibility, and accuracy. First is the percent agreement from the study that was just conducted. This will usually be a round number, like 80% or 90%, because there are so few samples being studied. But does that mean that, if we gave the operators 100 more parts to evaluate, they would be consistent exactly 80 times? No. Instead we calculate the second metric, which is the confidence interval.

Figure 2: Three numeric methods for evaluating a pass/fail measurement system
Figure 2: Three numeric methods for evaluating a pass/fail measurement system. Source: Tracy Owens

The confidence interval for a proportion is calculated statistically using a constant from the standard normal table, the sample size, and the proportion defective from the actual study. The confidence intervals tell us what the likely percent agreement would be if we did, indeed, give the operators 100 more samples to measure.

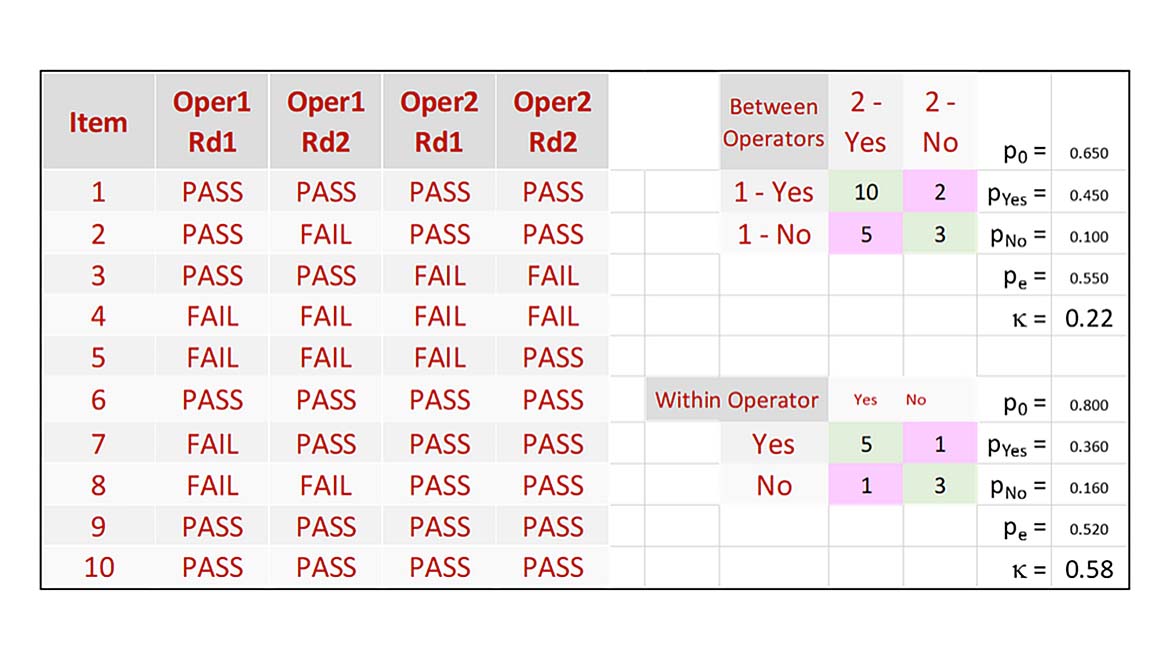
The third metric used to evaluate a pass/fail measurement system is the Kappa score, which is calculated not simply based on whether the responses were the same or not, like scoring “pass” in round one and “fail” in round two for the same item. Kappa scores also consider the direction of the mismatch, like saying “pass” when it should have been “fail” and saying “fail” when it should have been “pass”. A Kappa score of 1.0 indicates a perfect match, while a score of 0.0 gives the process the same chance as flipping a coin, like an operator saying, “if it’s heads, I’ll say ‘pass’”. A desirable Kappa score is between 0.9 and 1.0, and a Kappa score between 0.7 and 0.9 can be acceptable if the process is monitored closely.

Figure 3: Kappa calculator built by the author in Excel
Figure 3: Kappa calculator built by the author in Excel. Source: Tracy Owens

I regard the MSA as a project within the project, for if the data cannot be trusted we must pause the improvement project and improve our ability to measure the process. Figure 4 shows a process with an unacceptable amount of measurement variation, and Figure 5 shows that same process after improvements were made to the way operators measure their work. You can see in the graphs that there is less variation in Figure 5.

Figure 4: Gage study with continuous data – prior to improvements, built in EngineRoom
Figure 4: Gage study with continuous data – prior to improvements, built in EngineRoom. Source: Tracy Owens
Figure 5: Gage study with continuous data – after improvements, built in EngineRoom
Figure 5: Gage study with continuous data – after improvements, built in EngineRoom. Source: Tracy Owens

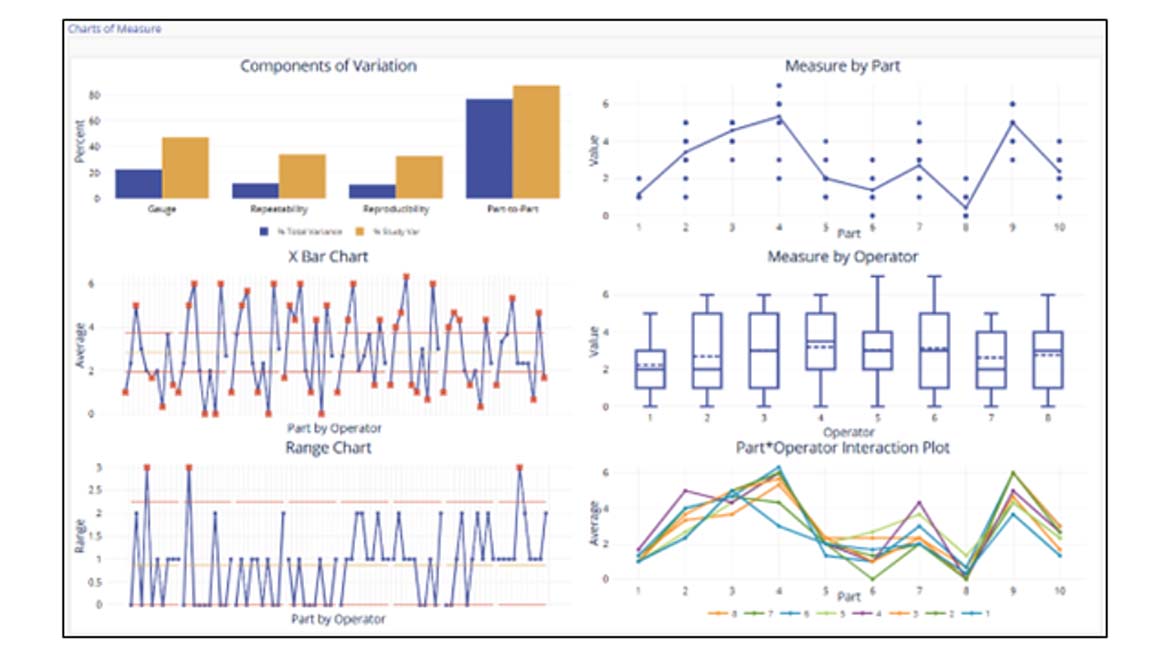
Note that these two MSA results are not built for a pass/fail type of evaluation. They are based on a continuous measure, like the outside diameter example above. For this type of variable, a Gage R&R study is conducted. The R&R letters stand for repeatability and reproducibility. Figure 6 shows the graphical output of a Gage R&R study where each operator’s assessment of all ten parts is shown. Success in such a study would look like a flat horizontal line, like you see in the frames for part numbers 5 and 9. Any diagonal lines show a mismatch and lack of repeatability, and staggered clusters show a lack of reproducibility among the three operators.

Figure 6: Gage run chart built in Minitab
Figure 6: Gage run chart built in Minitab. Source: Tracy Owens

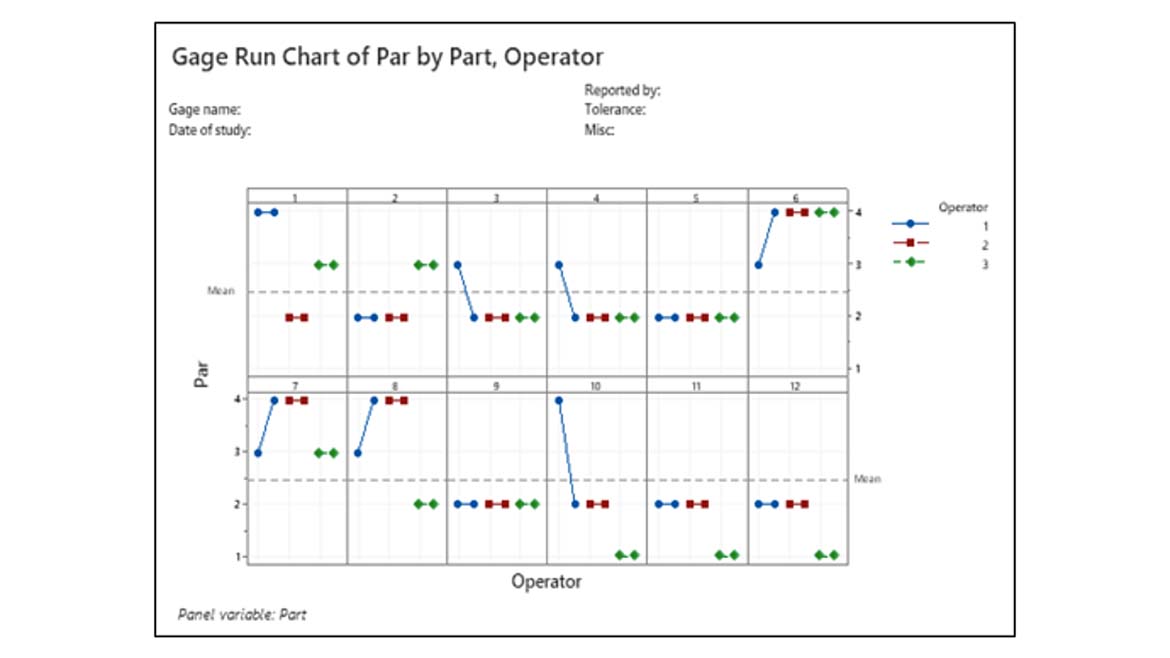
Showing and explaining these graphs to the project team and to a steering committee helps them understand the opportunity for improvement. Once the study is complete and the measurement system is improved, the project team can continue with confidence in the data.

A Bonus Outcome

One unexpected benefit of the MSAs that our students have conducted in the last year is the ongoing applicability of this method in the workplace. Several of the project sponsors were so impressed by the MSA setup and interpretation of results that they have incorporated the measurement study into their new hire orientation. Figure 7 is an example of an executive presentation where an MSA has been added to new hire training. For me, this is a thrilling outcome – the use of statistical tools to help people do their jobs more effectively. The win-win relationship between capstone sponsors and their students continues to grow stronger through the detailed and relevant deployment of trusted analytical tools.

KEYWORDS: data collection DMAIC manufacturing Measurement System Analysis (MSA) quality

Share This Story

Looking for a reprint of this article?
From high-res PDFs to custom plaques, order your copy today!

Tracy owens author 200x200 headshot

As a founding member of ASQ’s Innovation Division, Tracy Owens has promoted a growing body of knowledge on innovation management. His latest book F-Notes: Facilitation for Quality was released in late 2020. Tracy Owens | LinkedIn

Recommended Content

JOIN TODAY
to unlock your recommendations.

Already have an account? Sign In

  • 2024 Quality Rookie of the Year Justin Wise 1440x750px banner with "Quality Rookie of the Year" logo inset

    Meet the 2024 Quality Rookie of the Year: Justin Wise

    Justin Wise is an exceptional individual who has been...
    Aerospace
    By: Michelle Bangert
  • Man with umbrella and coat stands outside while it rains at night looking at a building.

    Nondestructive Testing: Is there an ethics problem?

    I was a whistleblower who exposed fraudulent activities...
    NDT
    By: Dale Norwood
  • Unraveling Deflategate: Football stadium with closeup of football on field

    Unraveling the Tom Brady Deflategate

    The Deflategate scandal erupted following the 2014 AFC...
    Measurement
    By: Greg Cenker and Henry Zumbrun
Manage My Account
  • eMagazine Subscriptions
  • Newsletters
  • Online Registration
  • Subscription Customer Service
  • Manage My Preferences

More Videos

Sponsored Content

Sponsored Content is a special paid section where industry companies provide high quality, objective, non-commercial content around topics of interest to the Quality audience. All Sponsored Content is supplied by the advertising company and any opinions expressed in this article are those of the author and not necessarily reflect the views of Quality or its parent company, BNP Media. Interested in participating in our Sponsored Content section? Contact your local rep!

close
  • Key Takeaways for Quality Leaders
    Sponsored byComplianceQuest

    Key Takeaways for Quality Leaders from the 2026 Gartner Magic Quadrant™ for QMS

  • This image shows a person seated next to a Bobcat T66 compact track loader.
    Sponsored byPolyWorks by InnovMetric

    Supercharging Digital Gauging at Bobcat North America

  • Dorsey Calibration Lab photo by Tom LaBarbera Picture this Studios
    Sponsored byDorsey Metrology International

    Ensuring Product Quality in a Competitive Manufacturing Landscape

Popular Stories

This image shows a person seated next to a Bobcat T66 compact track loader.

Supercharging Digital Gauging at Bobcat North America

a professional in the aviation field performing maintenance, repair, and overhaul (MRO) work

Manufacturing Retention: Strategies for Improving Company Culture, Engagement and Skill Development

Dorsey Calibration Lab photo by Tom LaBarbera Picture this Studios

Ensuring Product Quality in a Competitive Manufacturing Landscape

2026 Quality Professional of the Year!

Events

June 22, 2026

Automate 2026

Automate is North America's largest robotics and automation event — and the best place to take your ideas from insight to impact.
 
Our show floor features the world’s leading automation solutions, from AI and robotics to motion control, vision systems, and more. Plus, our educational conference is second to none, led by the brightest minds in automation today.
 
Ready to transform the way you work? Take the next step at Automate.
July 14, 2026

Quality Leaders Forum: Better Communication, Better Quality Data

The Quality Leaders Forum is a quarterly, editor-moderated fireside chat series hosted by Quality Magazine, featuring candid conversations with senior manufacturing and operations executives shaping enterprise-level quality.

View All Submit An Event

Products

Lean Manufacturing and Service Fundamentals, Applications, and Case Studies

Lean Manufacturing and Service Fundamentals, Applications, and Case Studies

See More Products
Quality Podcast Channel Custom Content

Related Articles

  • Large silver grooved gear containing dirt and a green plant, with three smaller gears connected to it.

    Measurement System Analysis Has a Place in Sustainable Manufacturing

    See More
  • Coordinate measuring machine (CMM) . The device is being programmed by a young male to measure the physical geometrical characteristics of an object. The operator is concentrating on the procedure. A display screen is seen in the background.

    The 101 on Measurement System Analysis

    See More
  • Digital Transformation

    How to Realistically Kick Off a Digital Transformation Project and Ensure Long-Lasting Benefits

    See More

Related Products

See More Products
  • louis hannigan.jpg

    The Non-Idiot's Guide to ISO 9001:2015: Understanding and Using the Quality Management System Standard to your benefit

  • Failure Mode Effects Analysis (FMEA) DVD

  • Work Measurement DVD

See More Products

Events

View AllSubmit An Event
  • December 16, 2025

    Focus On CAPA: Enhancing Failure Investigation & Root Cause Analysis & Benefits of AI Powered QMS

    On Demand Gain valuable insights into how to apply failure investigation techniques to identify true root causes and develop effective corrective actions.
View AllSubmit An Event

Related Directories

  • Starrett-Bytewise Measurement Systems

    Starrett-Bytewise provides in line, continuous, dimensional profile measurement technology. Applications include tires, rubber extrusion, plastic extrusion, roll forming, pipe & tube, and wire & cable.
×

Stay in the know with Quality’s comprehensive coverage of
the manufacturing and metrology industries.

Newsletters | Website | eMagazine

JOIN TODAY!
  • RESOURCES
    • Advertise
    • Contact Us
    • Directories
    • Manufacturing Division
    • Store
    • Want More
  • SIGN UP TODAY
    • Create Account
    • eMagazine
    • Newsletters
    • Customer Service
    • Manage Preferences
  • SERVICES
    • Marketing Services
    • Market Research
    • Reprints
    • List Rental
    • Survey/Respondent Access
  • STAY CONNECTED
    • LinkedIn
    • Facebook
    • YouTube
    • X (Twitter)
  • PRIVACY
    • PRIVACY POLICY
    • TERMS & CONDITIONS
    • DO NOT SELL MY PERSONAL INFORMATION
    • PRIVACY REQUEST
    • ACCESSIBILITY

Copyright ©2026. All Rights Reserved BNP Media, Inc. and BNP Media II, LLC.

Design, CMS, Hosting & Web Development :: ePublishing