Aerospace | NDT in Aerospace
How Advancing CT Analysis Capabilities Support Collaboration and Product Quality
The looping of CT analysis via digital models can improve every aspect of the design-to-production cycle.
Source: Volume Graphics, Hexagon and Getty Images
Industrial computed tomography (CT) scanning and data analysis are most often used by manufacturers to inspect final products. This is done in batches, randomly, or at set junctures that serve statistical analyses or simple pass/fail standards. The technology also has an important role in R&D and prototyping for verifying the interior, metallurgical quality of a part ahead of locking down a process or a challenging geometry.
Limiting CT analysis to just series and final spot-inspection overlooks profound, additional contributions that its associated software can make as a powerful, end-to-end, multi-disciplinary collaboration aid—interconnecting design and manufacturing and even field-service forensics with valuable quality and part-specification data.
The vast digital loop across key domains that CT analysis can play a role in allows it to contribute critical insights back to design from embedded simulation and virtual metrology testing, as well as all phases of process examination and related refinements. The software offers true as-manufactured, Geometric Dimensioning and Tolerancing (GD&T) for model correction and understanding process variation. And it can conclude with fully-automated, AI-assisted, final inspection based upon those highly accurate results.
DIGITAL TWINS AND THEIR ROI
The looping of CT analysis via digital models through key disciplines can improve every aspect of the design-to-production cycle. Digital twin (DT) models of CAD geometry, along with their simulation, process, material, quality, factory, and service twins, allow for fast access and feedback to-and-from expert collaboration teams. Studies from the Design for Assembly/Manufacturing community have shown that upfront analysis in design saves 40 percent in the total development cycle.
CT data analysis can help connect organizational silos, return information back to design, enhance optimization, improve quality, prevent late production failures, and slash overall development time. Because time is a cost factor often more important than direct costs, front-loading efforts in development has positive, long, and deep economic impacts for manufacturers: Quality is a prerequisite to successful market entry, customer satisfaction, branding, and business sustainability.
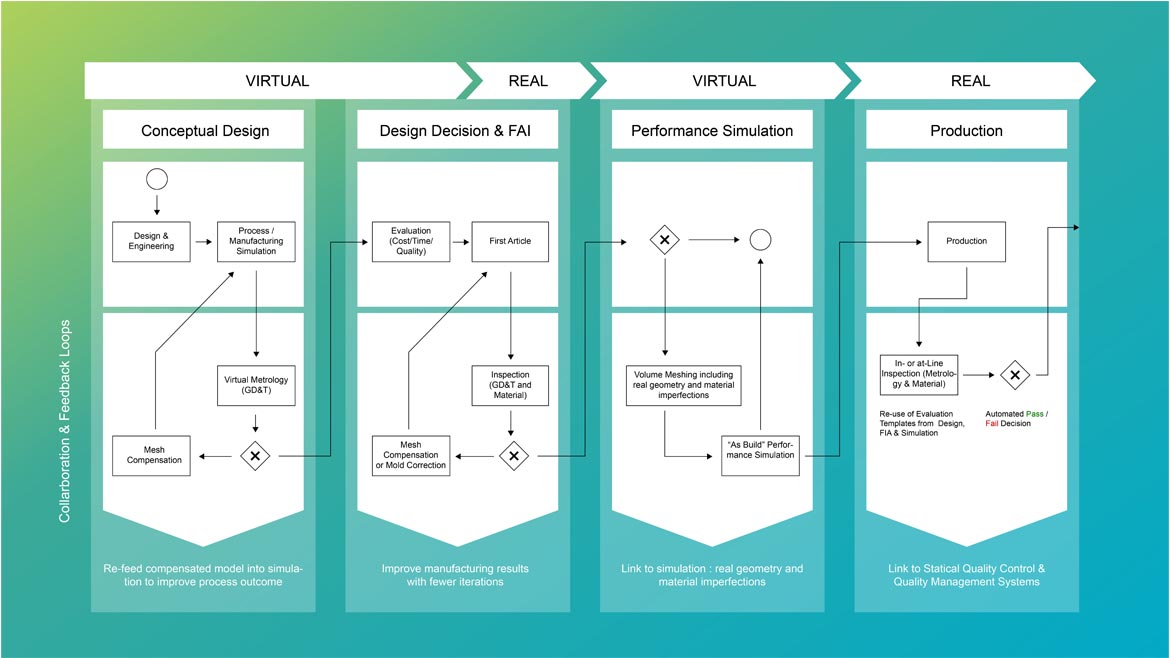
Image 1. Product loops and collaboration path using CT analysis software. Image courtesy of Volume Graphics
COLLABORATION STEPS
Whether it’s through manual documentation and/or digital platforms, product development-to-production approaches generally work in stage gates or release-management phases, where progress on a design and process decision are analyzed, approved, and deployed in steps. The best of these sequential reviews provides for fastest iteration of new information that can significantly refine or even redefine the conceptual work comprising early geometry, material, and process choices.
The introduction of CT analysis into early stage-gate loops, post-geometry creation, and process/manufacturing simulation keeps designs on track by replicating actual, downstream performance. It’s here that virtual metrology—fault detection and GD&T analysis—predicts material quality and potential process behaviors that can affect how parts fit or will move together in an assembly.
Aerospace
A Quality Special Section
If any areas need improving, mesh analysis and morphing of the virtual product re-feeds compensated modeling data back into the simulation to better approximate final geometrical integrity and material boundaries/distortions that arise from heating, cutting, laser-powder-bed printing, casting, laying up, or molding a part.
After this validation round, the CT-analysis loop can continue into hard prototyping and first-article inspection (FAI) as a next stage gate. If the current simulation and virtual metrology testing of the digital model is deemed complete, then the physical FAI is created, preferably made by the actual production process to be used.
Now the digital world meets the real world: CT analysis provides teams with both an as-manufactured surface scan and a full interior view into the part--exactly as the design output and the selected process will make it. Porosity/inclusions, cracks, fiber or grain orientations, deformations, delaminations, and areas of low density and weakness are revealed and compared to specifications. This process is reiterated with the output/results fed back into the simulation of the manufacturing process, as many times as needed.
Next, the real-world information from the CT-scan data analysis can inform teams throughout the organization via PLM or another user platform to respond quickly and definitively to any needed changes. The software provides the basis for continuous improvement throughout development and production with checks on material integrity, process problems and any root-cause analyses needed for corrections to tooling, materials, and design parameters—earlier and more time- and cost-effectively than otherwise.
With this phase nearly done, the collaboration loop proceeds to a performance simulation of the manufactured, “as-built” part. Using real geometry and material models drawn from the part’s measured microstructures, high-fidelity FEA hones in to predict stiffness, strength, fatigue, thermal conductivity, etc., as appropriate.
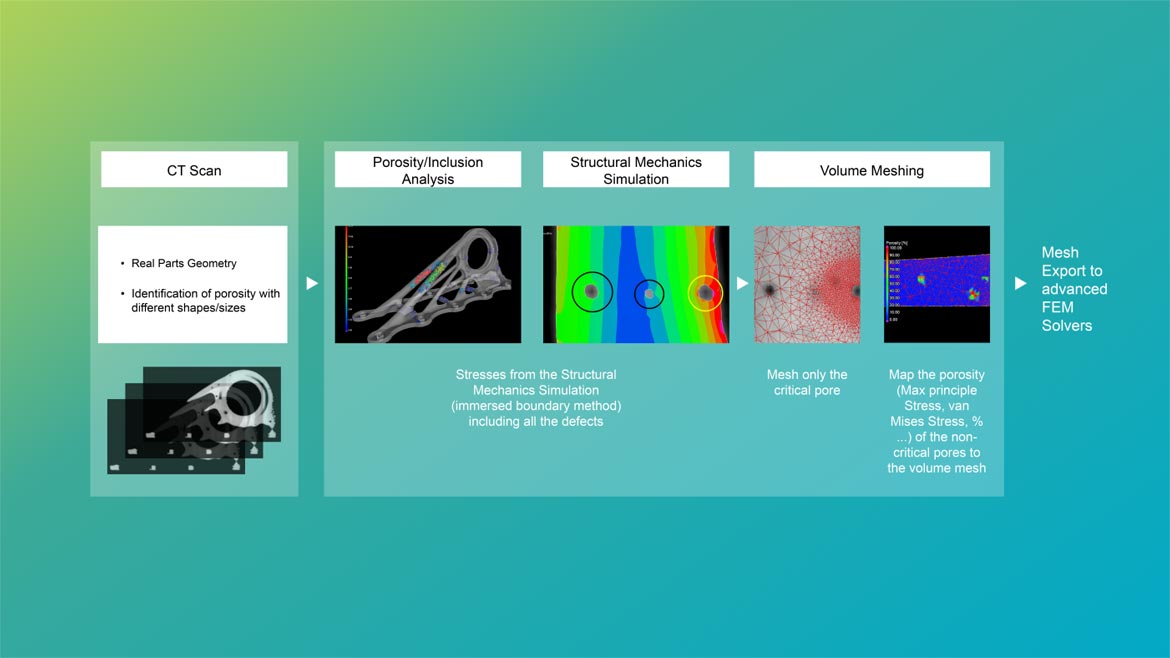
Image 2. CT data of real-world part metrology informs high-fidelity FEA analysis that in turn updates earlier stress and failure templates, and provides the later measurements required for final, automated part inspection. Software is VGSTUDIO MAX from Volume Graphics. Image courtesy of Hexagon
FEA MESHING
Finite Element Analysis (FEA) is a predictive tool for all the multi-physical events a material and/or a product may experience in both production and the field. FEA’s ultimate accuracy and value is based on validation via strain gages, destructive testing, correlation reviews and, increasingly, CT-analysis data that generates the ground truth about final material, process, and product configuration.
CT analysis can serve each phase of product development with an embedded FEA meshing program that includes GD&T technology—because materials distort, expand, and shrink in sometimes unpredictable ways. Capturing final surface dimensions and tolerances between mating surfaces is crucial to reducing design-to-production cycles and understanding process variation in a manner that can be isolated, fixed, and tracked.
Using digital surface data and deep interior scans supercharges the subsequent, high-fidelity FEA analysis that is used to create templates for both early development, future product concepts, and automated production inspection.
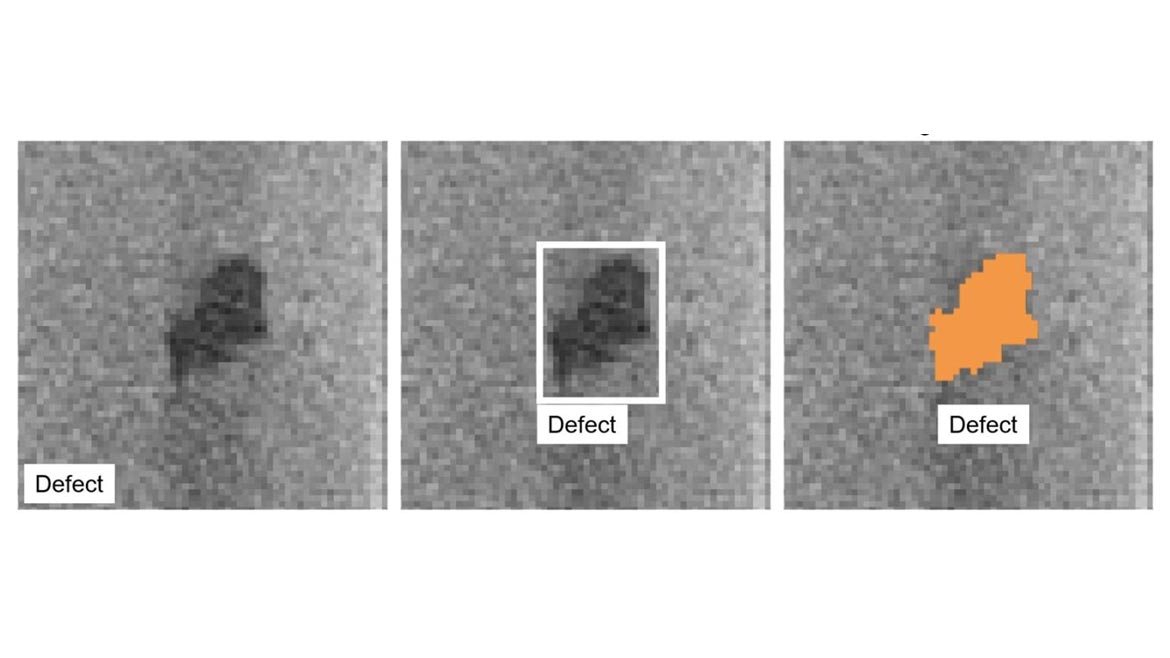
Image 3. Artificial intelligence and machine learning are powerful techniques for labeling, classifying quality data, localizing problems, and segmenting defects for identification and action during automated CT inspection. Image courtesy of Volume Graphics
AUTOMATED INSPECTION
Automated inspection reduces human input and lowers errors and costs through repeatability. Aiding in the speed and accuracy of automated inspection is the use of artificial intelligence (AI) and machine learning (ML) techniques.
AI and ML trained with synthetic data help identify areas difficult or impossible to detect and understand through visual means alone. Manufacturers need to know the size, diameter, depth, and distance between defects/flaws to predict their impact on part performance. AI/ML enables the system to find smaller defects more reliably and reduce scan time. This data is looped back to refine FEA analysis. Once patterns are captured, “classified,” and “localized”—they are "segmented" for better and quick identification. (See image 3.) Algorithms aid and are trained by the CT segmentation process and go on to form templates that serve automated in-line or at-line inspection.
Real-world data, again, is the grounded truth of a part’s quality and ability to meet specifications. It is also used to feed statistical analysis for integrated Manufacturing Execution Systems (MES) that monitor machine variation and are the foundation of Industry 4.0 initiatives.
EV BATTERIES AND TURBINE BLADES—TWO IDEAL APPLICATIONS FOR CT DATA ANALYSIS
Lithium-ion batteries for electric vehicles, home and commercial power storage/backup systems, and more have advantages over other types of metal and lead batteries, but also require strict quality monitoring. CT analysis can be used from early R&D through production to end-of-life inspections for Li-ion batteries. While the software can’t tell us about cell electrochemistry, mechanical attributes that result from that chemistry do reveal the status of the unit and can be inspected at any point. Thermal runaway, for example, can alter mechanical conditions (and vice versa). This is one dynamic among many that can be measured and compensated for in design and/or production.
Battery optimization at the front-end of design addresses wall spacing, seals and tolerances, chemical-cell distributions, housing construction, and more. During production, defects can occur that, once spotted, can be removed early on from the manufacturing chain. Delaminations, localized foreign particles (from cutting), and irregularities in the layers of the electrode package are typical targets for inspection. Welding of the contacts and sealing of the housing also introduce potential failure points that can result in short circuits.
The use of AI/ML greatly aids in understanding the very significant complexity of battery design and production. With so much at stake, automating CT analysis and using it collaboratively improves battery design, manufacture, and end-inspection—allowing for the highest reliability and electrical output.
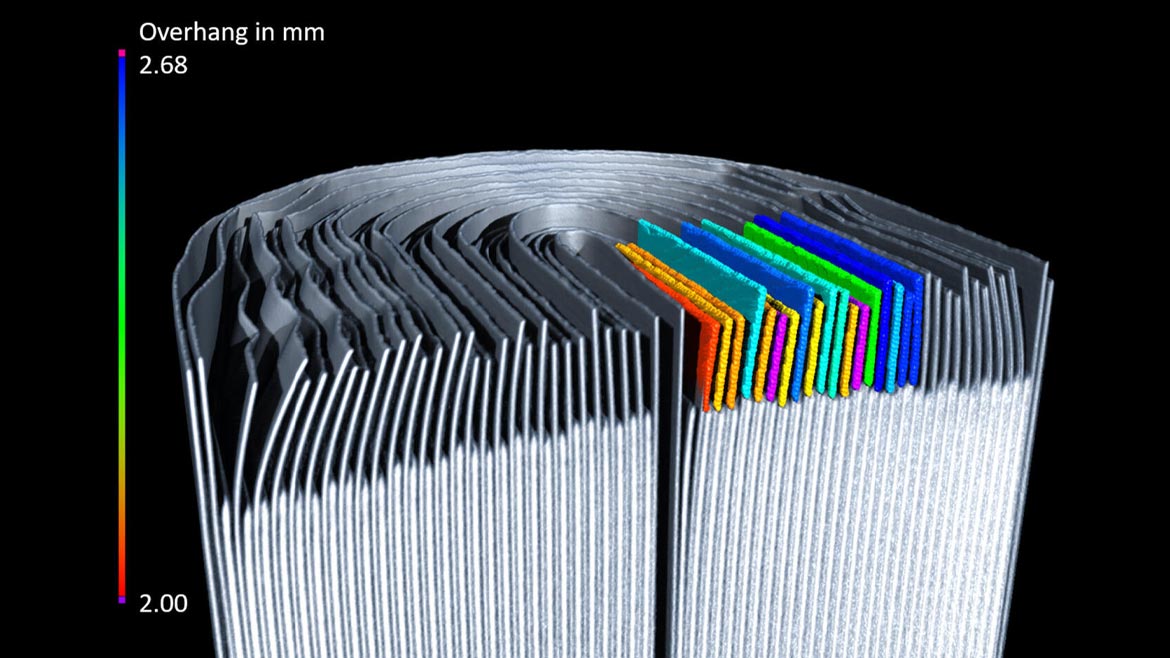
Image 4. Volume Graphics' software allows the measurement of anode overlap. The amounts of protrusion are shown using a color scale, which in this example ranges from 2 mm (red) to 2.68 mm (blue). A constant and desired anode protrusion requires high-precision manufacturing and inspection. Image courtesy of Volume Graphics, Scan: Waygate Technologies (formerly GE Inspection Technologies)
Breakthroughs in maintenance, repair and operations (MRO) for turbine blades and other tooling-intensive aircraft parts will have significant economic impacts well beyond the aviation industry.
Boeing and Airbus are aiming to reach pre-COVID production numbers for their aircraft but have had to taper back because of a shortage of jet engines. Considering these shortages, it is crucial for MRO programs to keep existing engines and aircraft flying as long as possible until new planes enter the market.
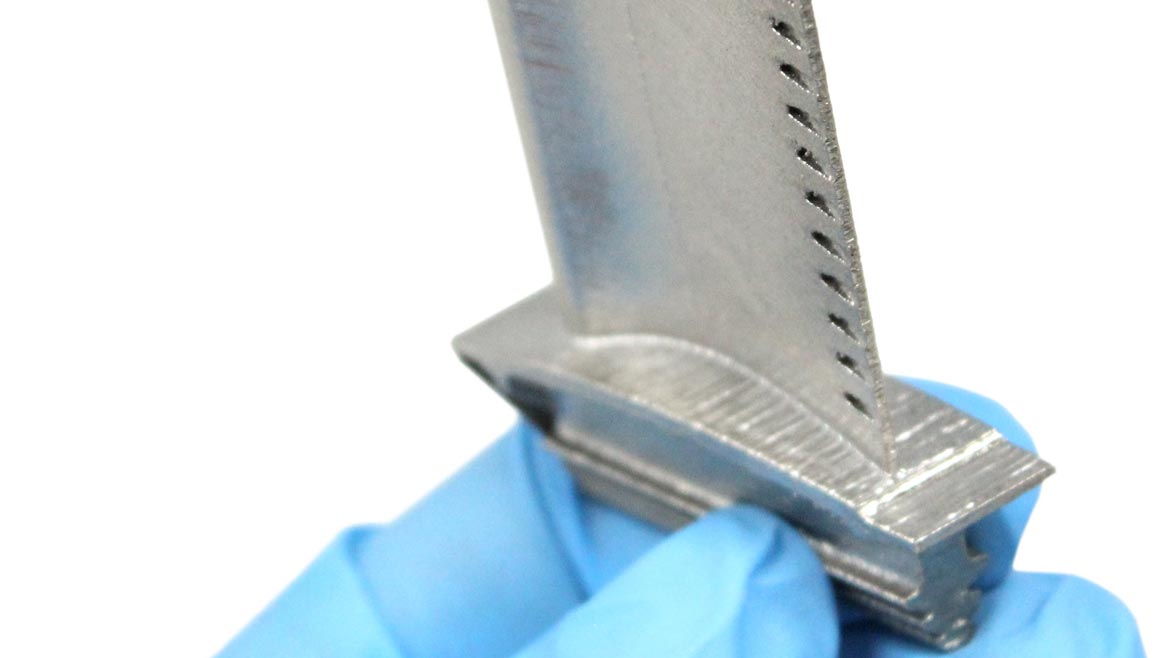
Image 5. Turbine blade 3D printed out of Hastelloy X using laser powder bed fusion (LPBF). Photo courtesy Velo3D. Both new blades (above) and out-of-service blades repaired by welding or Directed Energy Deposition (DED) can benefit from CT analysis. The data can inform teams from design, simulation, quality, manufacturing, and MRO about a part’s real-world quality.
Turbine blades are high-cost, high wear-and-tear parts that operate in very harsh conditions. This makes them an excellent candidate for analysis. CT scanning of inspection-due turbine blades captures their surface metrology and the part’s inner features, such as repairable wall thickness, along with data on flaws, defects, and cracks.
If it’s decided that a blade can be refurbished, a CAD model is directly created from a CT scan (or STL). Next, embedded software for welding and/or DED process simulation is used to predict the repair outcome and in-service heat distortions that the blade will experience. Following physical repair, the blade is again scanned for quality. It also undergoes simulation for the machining phase and is once more scanned to determine if it can go back into service.
The value of CT to aviation safety examples such as turbine blade or landing gear maintenance and repair is clear. In addition, great expense can be saved by avoiding new tooling for legacy parts and creating economic alternatives to grounding planes and reducing air travel.
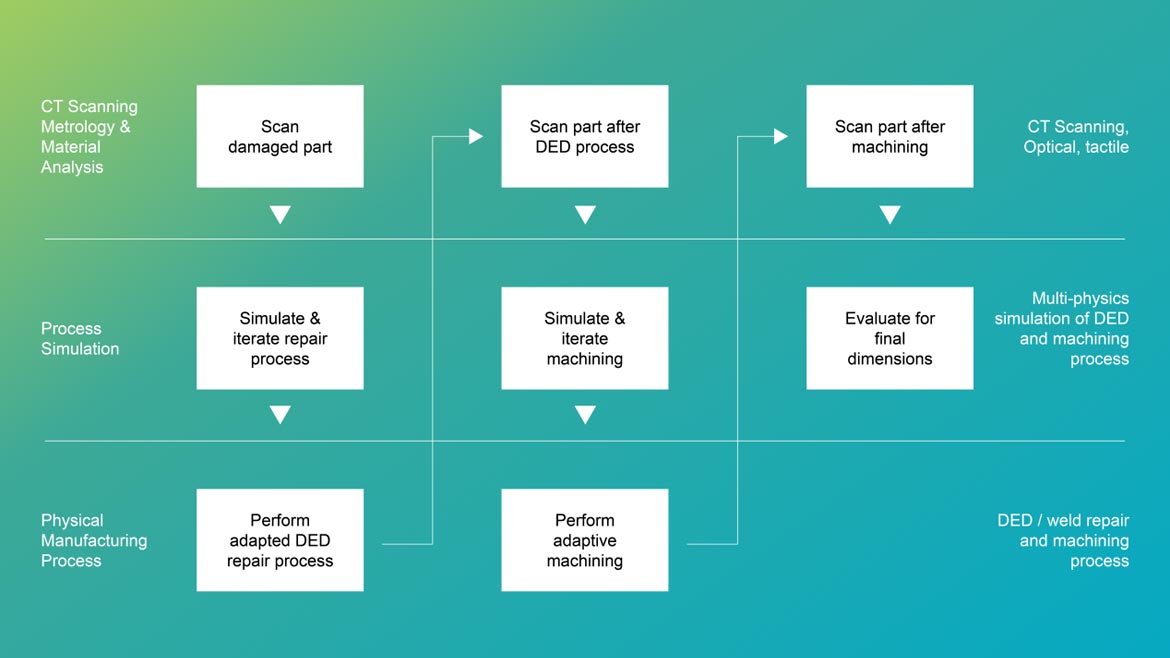
Image 6. Flow chart of CT analysis for DED turbine-blade repair. Image courtesy of Volume Graphics
BRIDGING QUALITY AND COLLABORATION WITH CT ANALYSIS
Advances in CT scanning and data-analysis software are enriching every phase of product development and manufacture. Real-world CT surface and interior data is helping to improve and validate models, simulations, materials, processes, and finished products.
The software has advanced far beyond end inspection to connect multiple disciplines around trusted data—speeding up development and ensuring that manufacturers can better collaborate to increase quality and lower risks.
In turn, deployment of AI and ML that support automated inspection will lower costs and give manufacturers the deepest confidence in the products that they sell to their customers.
Looking for a reprint of this article?
From high-res PDFs to custom plaques, order your copy today!


")