Management
The Modified Fink Risk Analysis Method for Conformity Assessment Bodies
Risk assessment is not a one-time exercise but a continuous cycle that must adapt to changes in organizational context, industry regulations, and emerging threats.

Image Source: PJLA
This article explores the significance of risk management in Conformity Assessment Bodies, examining the key principles, strategies, and tools that can help CABs identify, assess, and mitigate risks. By understanding the potential risks they face and implementing appropriate risk management measures, CABs can enhance their resilience, improve the accuracy of their assessments, and ensure their long-term success in an increasingly competitive and dynamic global marketplace. Through a practical approach, this article provides insights into integrating risk management practices into the core operations of CABs, offering guidance to both new and seasoned professionals in the field.
Methodology
The modified Fink Risk Analysis Method is particularly well-suited for Conformity Assessment Bodies (CABs) due to its systematic, structured approach to identifying, evaluating, and managing risks within complex environments. The Fink method provides a clear framework for addressing these risks by integrating both qualitative and quantitative factors, enabling CABs to assess risks from multiple perspectives.
Application of the proposed modified Fink Risk Analysis Method
The following key steps outline the process involved in the modified Fink Risk Analysis Method for Conformity Assessment Bodies (CABs):
Step 1: Risk Identification
A crucial first step in Risk Assessment (hereafter, "risk(s)" is used interchangeably for risk/opportunity) is gaining a thorough understanding of the business and its associated interested parties. Practitioners should consider key aspects such as:
- What defines the business?
- Is it product-based, service-based, or both?
- What level of public scrutiny does it face? Is it a regulated industry?
- Does it involve hazardous activities?
- Does it rely on contract workers?
- What are the associated liabilities?
- Who are the relevant interested parties?
This may include CAB staff and contractors, customers, the public, regulators, industry groups, and government entities.
Once these interested parties are identified, they should be engaged in discussions about potential risks within the business. If necessary, a brief overview of the business—derived from the considerations in question one—can be provided. Gathering input can be as simple as an email outreach or performing brainstorming sessions and does not require a complex or highly technical process. Involving individuals from various levels within the organization (e.g., administration, technical, management, finance) as well as external stakeholders (e.g., contractors, regulators, subject matter experts) ensures a diverse range of perspectives. This broad participation increases the likelihood of identifying and capturing relevant risks effectively.
Step 2: Risk Categorization
After gathering responses, the next step is to organize the identified risks into broad categories. This helps streamline the assessment process by grouping similar risks, reducing redundancy, and minimizing duplicate analyses. The categories should be relevant to the business, with examples including Regulatory Risks, IT Systems Risks, Conflict of Interest/Impartiality Risks, Resource Risks, Domestic Business Risks, International Business Risks, and Policy, Procedure, or Process Risks.
Once the categories are established, risks can be assigned accordingly. During this process, similar risks—those with overlapping subjects—can be merged to simplify the overall list. For instance, "Loss of power supply while testing" and "power supply breakage" can be consolidated into "Loss of power supply while testing."
Step 3: Risk Assessment
With the risks now categorized and consolidated where appropriate, the next step is to gather input from interested parties regarding the Impact (1-10) and Likelihood of Occurrence (1-100%) for each risk. Like the initial step, this process can be efficiently conducted via email and does not need to be complex or highly technical.
To proceed, organize the risks by category, identify the most relevant interested parties for each, and request their assessment by asking:
- What they believe the impact of each risk is on a scale of 1 to 10.
- What they believe is the likelihood of occurrence is on a scale of 1 to 100%.
Step 4: Risk Evaluation
Although the responses may initially suggest a clear prioritization of risks, it is essential to validate the preliminary findings by plotting the risks and calculating their respective values. Once all responses have been collected, determine the average Impact and Likelihood values for each risk. After compiling the risks into a single list, with one Impact value and one Likelihood value per risk, they can be visualized on a graph like the example below:
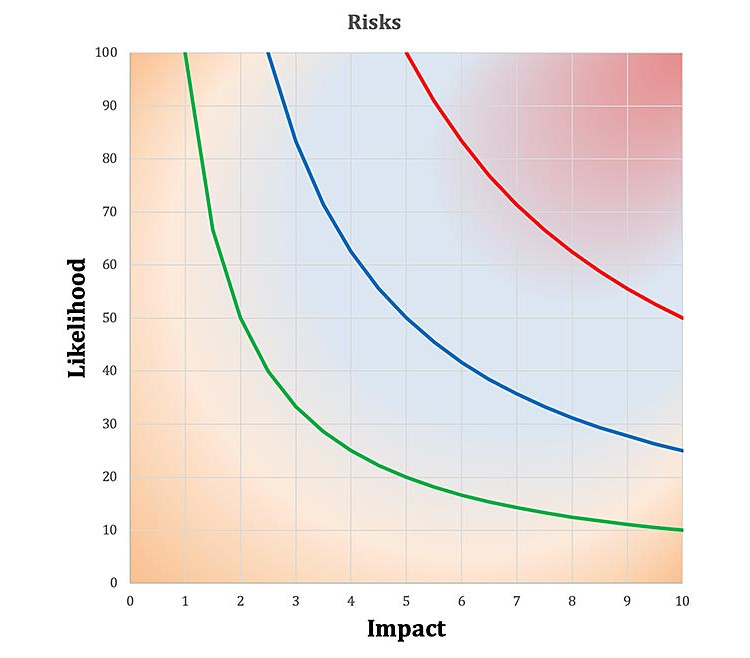
As shown, the X-axis represents the Impact, while the Y-axis represents the Likelihood. For example, you can compare the table below with the corresponding graph:
|
Risk Identifier |
Category |
Risk |
Impact (1-10) |
Likelihood (1 to 100%) |
|
A |
Process control - Inspection |
Loss of internet connectivity while performing an inspection |
5.9 |
71 |
|
B |
National Lockdown in response to pandemic |
7.1 |
79 |
|
|
C |
Service Completion |
Complicated inspection report requires too much time while on the jobsite which prevents project completion |
7.9 |
20 |
|
D |
Administrative |
Inspectors do not submit their reports on time |
2.8 |
32 |
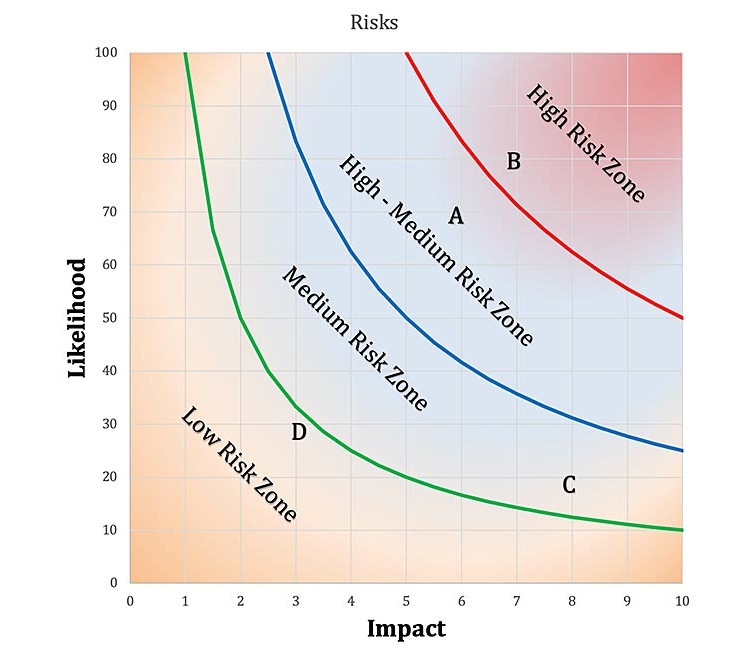
The graph above highlights the four risk level zones. Once the two values are plotted, each risk falls into a specific zone. For example, Risk A is categorized as high-medium risk, Risk B is high risk, Risk C is medium risk, and Risk D is low risk. These risks are clearly placed on the graph; however, what happens when the impact and likelihood values are much closer to each other?
Consider the graph and table below:
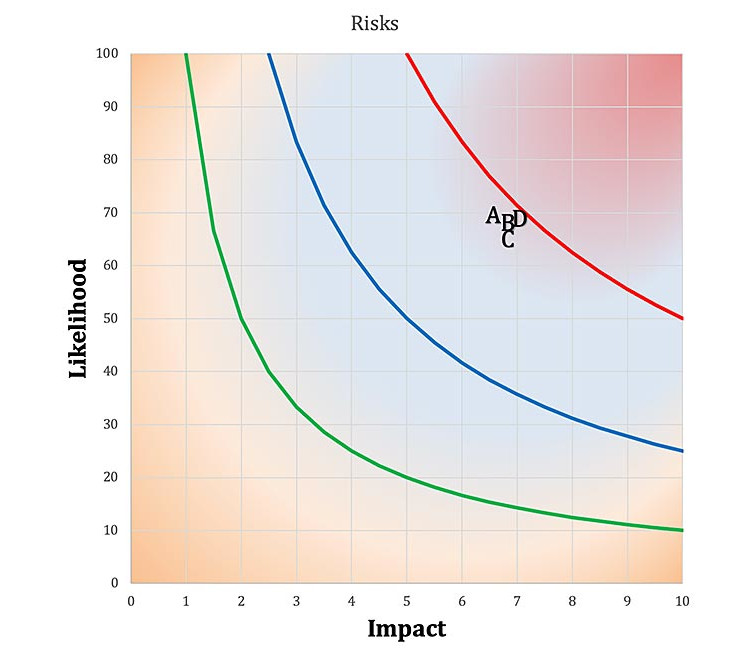
The risks above have impact and likelihood values that are so similar, making it challenging to determine which is more critical. In this case, you can calculate the exact Impact Value (IV) for each risk. To do so, multiply the Impact by the Likelihood; the calculated IVs are shown in the far-right column of the table below.
|
Risk Identifier |
Category |
Risk |
Impact (1-10) |
Likelihood (1 to 100%) |
Impact Value (Impact x Likelihood = IV) |
|
A |
Process control - Inspection |
Loss of internet connectivity while performing an inspection |
6.5 |
70 |
455 |
|
B |
National Lockdown in response to pandemic |
6.7 |
69 |
462.3
|
|
|
C |
Service Completion |
Complicated inspection report requires too much time while on the jobsite which prevents project completion |
7.0 |
66 |
462 |
|
D |
Administrative |
Inspectors do not submit their reports on time |
7.2 |
67 |
482.4 |
After calculating the IV for each risk, reorder them to reflect their ranked positions. Based on the results above, Risk C has the highest value, indicating that it is the most critical of the four example risks. Below is the reorganized ranked list based on the IV:
|
Ranked Order |
Risk Identifier |
IV |
|
1 |
D |
482.4 |
|
2 |
B |
462.3 |
|
3 |
C |
462 |
|
4 |
A |
455 |
Step 5: Identify Acceptable Risk Level (ARL) and Risks Exceeding ARL
Once a hierarchical list of risks is established and plotted on a graph to determine their positions within the four risk zones, organizations should define an Acceptable Risk Level (ARL). This level can be broadly determined based on the four risk zones, for example, considering all risks within the medium and low risk zones as acceptable, or more specifically based on a particular IV, such as classifying all risks with an IV less than 400 as acceptable. Once the ARL is determined, identify the risks that exceed the ARL. These are the risks that require treatment.
Below is an example for:
ARL = Risks with IV < 400
ARL = Risks < IV=400
|
Ranked Order |
Risk Identifier |
Calculated Impact Value (IV) |
Treatment Required? |
|
1 |
C |
483 |
Yes |
|
2 |
D |
473.6 |
Yes |
|
3 |
A |
465 |
Yes |
|
4 |
B |
453.6 |
Yes |
|
5 |
E |
419 |
Yes |
|
6 |
H |
400.2 |
Yes |
|
7 |
F |
398 |
No |
|
8 |
G |
350.4 |
No |
|
9 |
I |
343 |
No |
|
10 |
J |
320.5 |
No |
Step 6: Mitigation and Contingency Planning
The list of risks that require treatment are shared again with the interested parties, asking them to suggest mitigation and contingency plans for each risk. As with the previous steps, this process should not be overly time-consuming or technical, but it may require further clarification to ensure that the interested parties understand what is expected from the plans.
A mitigation plan is a plan designed to:
A. Reduce the Likelihood of Occurrence of the risk
Or
B. Reduce the Impact of the risk
Or
C. Reduce both the Likelihood of Occurrence and Impact of the risk
A mitigation plan is implemented immediately and aims to address A through C before a risk escalates into a crisis.
A contingency plan, on the other hand, is put in place if a specific risk develops into a crisis. It typically works to minimize the impact or duration of the crisis, as it is no longer possible to reduce the likelihood of occurrence at this stage.
In terms familiar to the conformity assessment industry, a mitigation plan can be viewed as preventive action, while a contingency plan can be considered corrective action or correction.
Once responses to the latest query have been received, similar to what was done with the risks in step 2, the mitigation and contingency plans should be reviewed, analyzed, and consolidated where applicable. For instance, two similar mitigation plans may be proposed for the same risk:
|
Risk |
Party A proposed mitigation |
Party B proposed mitigation |
|
Loss of power supply during testing |
Implement backup generators with automatic transfer switches to ensure continuous operation. |
Install UPS systems for critical equipment to provide temporary power during outages. |
Top management should be involved in deciding which mitigation and contingency plans to implement for addressing each risk. This is typically done through a risk discussion during a scheduled management review meeting, though in some cases, it may require a separate meeting.
Step 7. Ongoing Monitoring and Review
Once management has selected the plans they wish to implement, the organization proceeds with the execution. As mentioned earlier, mitigation plans rarely eliminate a risk completely; instead, they reduce either the Impact or Likelihood of Occurrence. This means that residual risk will still remain even after the plans are implemented. Depending on the success of the implementation, the level of residual risk may remain the same or decrease.
To calculate residual risk, follow a process similar to the one used in the initial information-gathering phase:
- Circulate the list of risks along with a brief description of the mitigation measures implemented.
- Ask interested parties to review the mitigation and provide updated values for Impact and Likelihood of Occurrence.
- Replot the risks and recalculate the IV for each one to determine the residual risk level.
If the residual risk is acceptable, document the justification for its acceptability.
If the residual risk is unacceptable, repeat the process and consider alternative mitigation measures until the residual risk is deemed acceptable.
When replotted after mitigation, there should be noticeable movement of the risks on the graph. For example, recall the graph with Risks A, B, C, and D shown in Step 4:
Now, let’s assume that mitigation measures have been applied to each risk as follows:
Risk A: Mitigation measure successfully implemented to reduce the Likelihood of Occurrence.
Risk B: Mitigation measure successfully implemented to reduce the Impact.
Risk C: Mitigation measure successfully implemented to reduce both the Likelihood of Occurrence and Impact.
Risk D: Mitigation measures are not successfully implemented to reduce either factor.
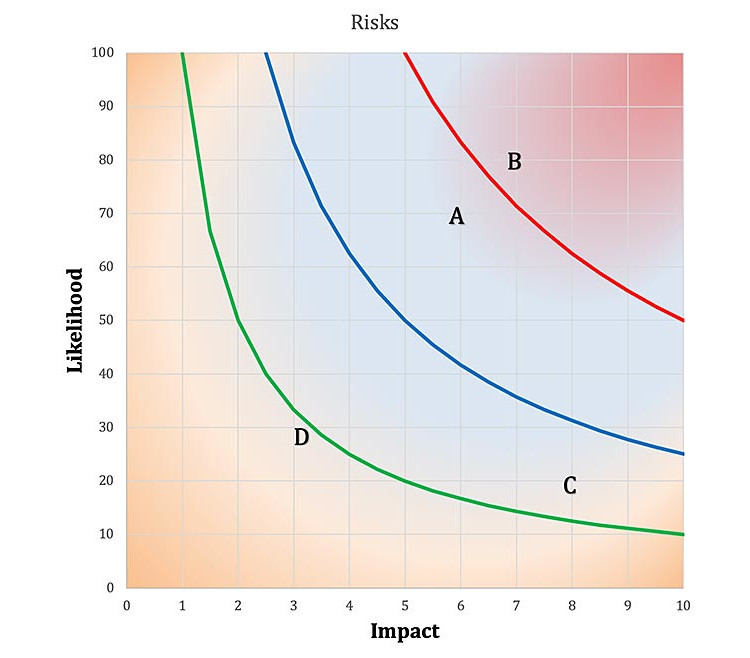
The movement of the risks on the graph would then appear as shown below:

Where A2, B2, and C2 represent the newly calculated IVs after implementing the mitigation plans: Reducing the Likelihood of Occurrence moves the risks vertically (A), reducing the Impact moves the risks horizontally (B), and reducing both the Impact and Likelihood of Occurrence moves the risks diagonally (C). For Risk D, since the mitigation plan failed to address either the Impact or the Likelihood of Occurrence, the risk plot remains unchanged. This can also be observed mathematically by comparing the IVs calculated before and after the mitigation.
After recalculating the numbers and confirming that the residual risk is acceptable, document the justification for this acceptability. If the residual risk remains unacceptable, repeat the process until an acceptable level of residual risk is achieved.
Epilogue
The Modified Fink Risk Analysis Method provides a structured yet flexible approach to identifying, assessing, and mitigating risks in a way that aligns with the unique needs of CABs. By incorporating stakeholder input, categorizing risks effectively, and leveraging both qualitative and quantitative evaluation techniques, this method enables CABs to make informed decisions about risk treatment.
Ultimately, risk assessment is not a one-time exercise but a continuous cycle that must adapt to changes in organizational context, industry regulations, and emerging threats. The Modified Fink Risk Analysis Method empowers CABs to systematically navigate uncertainties, maintain impartiality, and uphold the highest standards of compliance and operational integrity. By integrating this method into routine management practices, CABs can reinforce their resilience, sustain trust among stakeholders, and confidently fulfill their mission of ensuring quality and conformity in their respective fields.
References:
Steven Fink, "Crisis Management: Planning for the Inevitable", Universe, 2000
Steven Fink, "Crisis Communications: The Definitive Guide to Managing the Message", McGraw Hill, 2013
Dr. George Anastasopoulos, Patrick McCullen, Harry Makam, "Risky Business: A Comprehensive Risk Analysis of an Accreditation Body", International Journal of Conformity Assessment, Volume 2, Issue 1, 2023.
Looking for a reprint of this article?
From high-res PDFs to custom plaques, order your copy today!


