Quality Magazine logo
search
cart
facebook twitter linkedin youtube
  • Sign In
  • Create Account
  • Sign Out
  • My Account
Quality Magazine logo
  • NEWS
  • PRODUCTS
    • FEATURED PRODUCTS
    • SUBMIT YOUR PRODUCT
  • CHANNELS
    • AUTOMATION
    • MANAGEMENT
    • MEASUREMENT
    • NDT
    • QUALITY 101
    • SOFTWARE
    • TEST & INSPECTION
    • VISION & SENSORS
  • MARKETS
    • AEROSPACE
    • AUTOMOTIVE
    • ENERGY
    • GREEN MANUFACTURING
    • MEDICAL
  • MEDIA
    • A WORD ON QUALITY PUZZLE
    • EBOOK
    • PODCASTS
    • VIDEOS
    • WEBINARS
  • EVENTS
    • EVENT CALENDAR
    • IMTS
  • DIRECTORIES
    • BUYERS GUIDE >
      • Supplier Insights
    • NDT SOURCEBOOK
    • VISION & SENSORS
    • TAKE A TOUR
  • INFOCENTERS
    • Digital Quality Management Systems
    • NEXT GENERATION SPC & QUALITY ANALYTICS
  • AWARDS
    • ROOKIE OF THE YEAR
    • PLANT OF THE YEAR
    • PROFESSIONAL OF THE YEAR
  • MORE
    • Expert Columns
    • NEWSLETTERS
    • QUALITY STORE
    • INDUSTRY LINKS
    • SPONSOR INSIGHTS
  • EMAG
    • eMAGAZINE
    • ARCHIVES
    • CONTACT
    • ADVERTISE
  • SIGN UP!
MeasurementSoftware

Measurement

Surface Texture Metrology Matures

Visualization tools can improve how engineers understand part surfaces.

By Mike Zecchino, Mark Malburg
Hand holding material in front of laptop showing surface texture data.

Courtesy Digital Metrology Solutions

May 13, 2025
✕
Image in modal.

The answer to whether a part meets specification is often a “yes” or “no” on a printed report, a “good” part versus “bad.” However, these numerical values—the information passing from quality to engineering and manufacturing—is often not enough information to solve quality issues or improve processes.

In recent years, more measurement information is becoming available to design and production personnel. For example, the rapid adoption of 3D scanning has enabled engineers to explore data point clouds at their desks. This technology lets design teams visualize shapes and errors of a “digital twin,” and to explore and share that information. The ability to interact with the data offers vastly more information than a static report of numerical measurement results.

When it comes to surface texture however, most decisions are still made based on the handful of texture parameters measured in the lab. Those parameters, unfortunately, offer only a very limited view of how the surface will actually function.

As performance requirements become more demanding in areas such as sealing, wear resistance, friction, noise, vibration, adhesion, etc., the “shape” of surface texture has become far more important than the numerical roughness values. Just as point cloud analysis enables engineers to explore and visualize “macro” part data, the ability to explore and interact with “micro” surface texture data can provide a wealth of information about surfaces and how they perform.

Numerical data only tells part of the story

Over the past several decades, surface roughness measurement and analysis have been greatly developed and refined. Despite that development, however, most roughness specifications are still based on a handful of basic parameters such as Average Roughness (Ra, or Sa). These parameters can be helpful for spotting changes in parts or processes, but they give only the most general information about surfaces.

Figure 1 shows three very different surfaces that have nearly identical Ra values, yet, we can see that they are considerably different and would likely perform differently as well. Ra cannot distinguish peaks from valleys, gives no information about the spacing or position of peaks or valleys, etc. All these characteristics greatly impact how a surface will function.


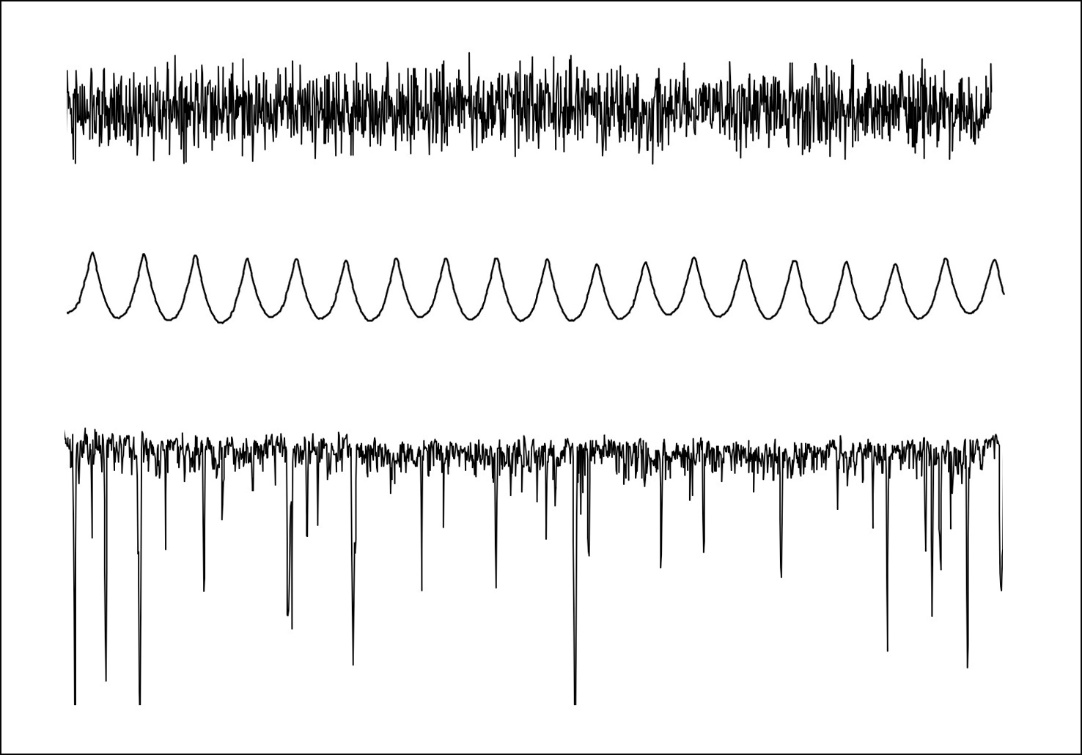
Figure 1. These surfaces have very different properties but almost identical average roughness (Ra) values. Numerical results are often insufficient to describe surface texture. Courtesy Digital Metrology Solutions


Seeing the data is more powerful than reading the numbers

For most of us, music notes on a page aren’t a “song” until we hear them played. The same is true for surface texture: parameters are just numbers until we see the surface and understand what they indicate.

The most powerful surface analysis tools are the human eye and the human brain. Thousands of times per day we look at surfaces and intuitively determine if they are rough, smooth, safe to walk on, dangerous to touch, nice to look at, etc.

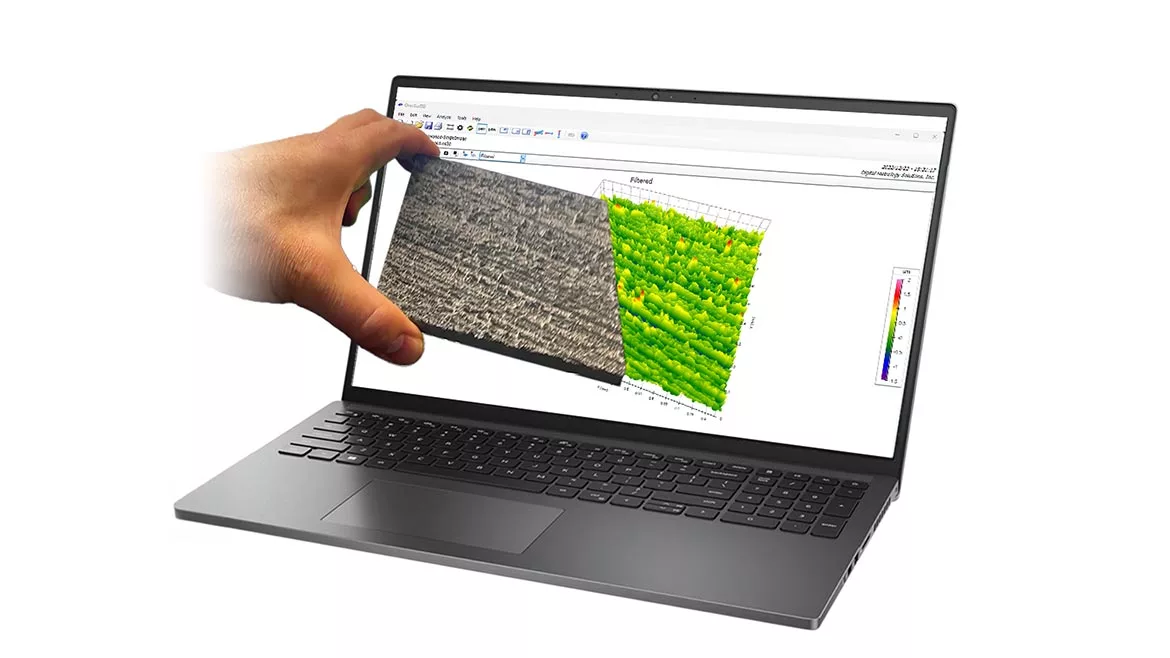
Figure 2 shows presentations of surface texture data that are progressively richer in information. A numerical parameter value (top) provides a summary of the texture. A 2D profile begins to show the shape of the surface, such as peak heights and spacings. A 3D image is even more informative, showing directionality and revealing “areal” features such as pits, porosity, etc. Some software even enables 3D printing of texture data, a powerful tool for exploring and sharing surface data.

Figure 2. Presentations of surface texture with progressively greater levels of information.

Figure 2. Presentations of surface texture with progressively greater levels of information.

|
Courtesy Digital Metrology Solutions

“Offline” data analysis

Seeing data (perhaps in a printed graph) adds to our understanding of a surface. The ability to interact with the data creates the opportunity to study and learn from it.

In most companies, the personnel responsible for designing and manufacturing surfaces are not necessarily those with access to the raw data. Traditionally, most analysis software was native to (and tied to) a particular measurement instrument and therefore only available in the lab. If a designer is analyzing data at that instrument, the instrument cannot serve its primary purpose of making measurements.

With newer software tools, lab personnel can measure and store texture data so that designers and engineers can explore and analyze it at their desks. This “offline” approach allows the quality lab to focus on its mission and expertise of producing accurate data, while design and manufacturing teams can leverage that data to better understand their products and processes.


Figure 3. A static printout (left) gives some indication of surface quality. Offline data (right) allows designers to explore and learn from measurements to improve parts and processes. Courtesy Digital Metrology Solutions

Offline software can typically analyze data from a variety of measuring systems. Thus, engineers can explore data from a variety of sources using a common platform.

Software can guide texture analysis

Surface texture analysis software is typically geared toward quality personnel who are expert in texture measurement. The dozens of parameters that impact measurements present a steep learning curve for users who have a more tangential understanding of texture.

To accommodate a wider range of users, more software tools are incorporating wizards and other organizational tools that guide a user through the analysis process (Figure 4). These tools promote interaction and separate the main data analysis functions from more obscure instrument settings. These tools can also help a non-expert user to understand how each analysis step impacts the data.

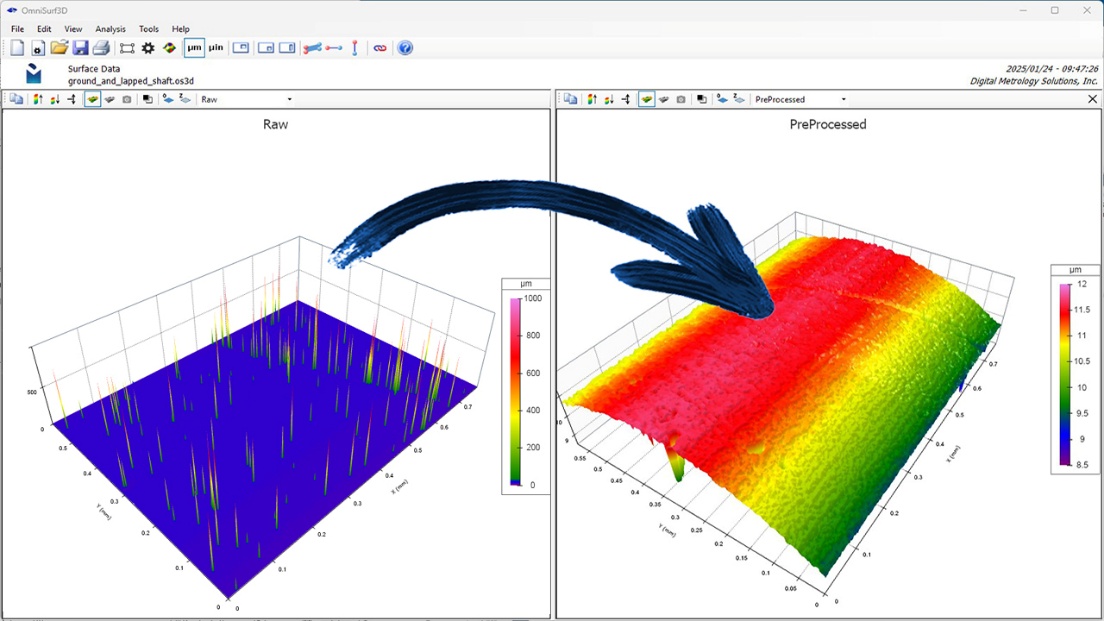
Figure 4. Software tools can guide surface texture analysis to help a non-expert achieve meaningful data. Courtesy Digital Metrology Solutions

Sharing data

Visualizations of surface texture can aid with process improvement, both across departments and along the supply change (Figure 5). The ability for management and production personnel to see surface data makes it easier to understand how aspects of texture affect performance.

Software can also offer a common platform for sharing point clouds throughout the supply chain. Sharing data can help solve discrepancies and disputes with suppliers and customers, reducing rework and rejection of parts.


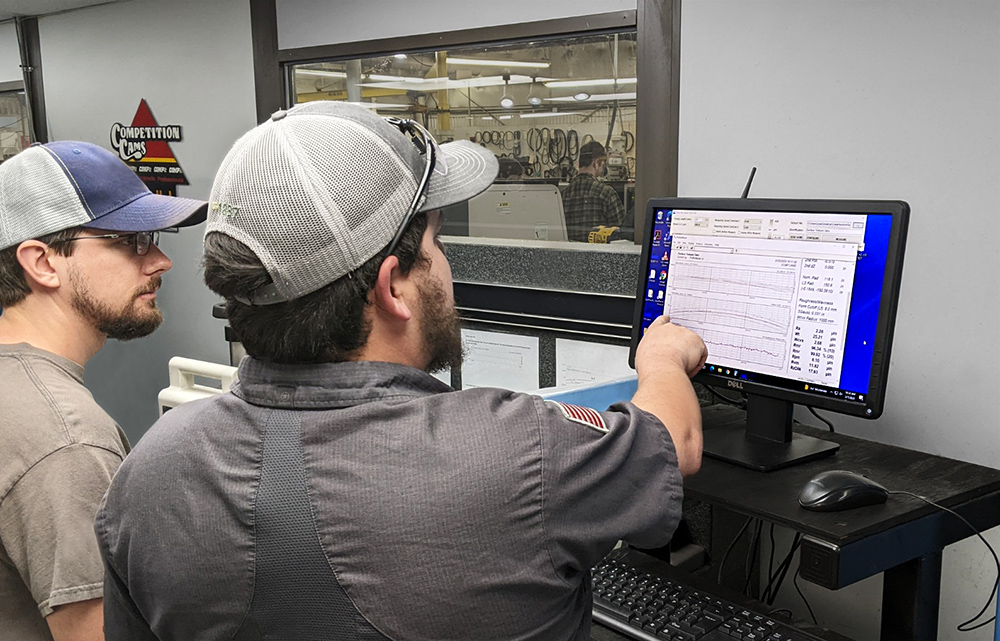
Figure 5. Texture visualization software helps experts and non-experts to share texture information and collaborate on process improvement. Courtesy Chris Potter and COMP Cams.

“Some assembly required”

Offline software offers a wealth of information for manufacturing and design teams. However, it does not replace training in order to reach fundamentally sound conclusions about the data. Quality experts must be involved in verifying any conclusions drawn, and in implementing any process changes based on those conclusions.

That said, when more personnel understand why changes are implemented, the chances for lasting improvement is greatly increased.

Conclusion

The ability to analyze and interpret surface texture data offline has opened vast possibilities for part design, process improvement, and collaboration. By providing intuitive tools for exploring surface texture, offline software provides a common platform for analyzing surface data. Designers can explore surface data directly to improve surface function, while quality and process engineers can dig deeper to discover the root causes of variation and to better control manufacturing for reliable component performance.

READ MORE

  • The Revolution of Automation and Metrology in Modern Manufacturing
  • How Accurate Surface Finish Measurement Improves Product Life and Performance
  • Ensuring Precision: A Guide to Calibration in Surface Finish Measurement
KEYWORDS: 3D scanning manufacturing metrology software programs surface measurement

Share This Story

Looking for a reprint of this article?
From high-res PDFs to custom plaques, order your copy today!

Mike Zecchino has been creating technical content and resources related to metrology and measurement for over 20 years. His articles have appeared in dozens of publications, and his training materials and videos support numerous measurement instruments and technologies.  He can be reached at [email protected]

Dr. Mark Malburg is the president of Digital Metrology Solutions. With over 30 years in surface metrology, he is the chief architect of a range of standard and custom software for surface texture and shape analysis. Dr. Malburg has consulted in numerous industries from optics to automotive and aerospace. He is active in ASME and ISO standards committees and has helped shape many of the standards that govern surface specification, measurement and control.

Recommended Content

JOIN TODAY
to unlock your recommendations.

Already have an account? Sign In

  • 2024 Quality Rookie of the Year Justin Wise 1440x750px banner with "Quality Rookie of the Year" logo inset

    Meet the 2024 Quality Rookie of the Year: Justin Wise

    Justin Wise is an exceptional individual who has been...
    Aerospace
    By: Michelle Bangert
  • Man with umbrella and coat stands outside while it rains at night looking at a building.

    Nondestructive Testing: Is there an ethics problem?

    I was a whistleblower who exposed fraudulent activities...
    NDT
    By: Dale Norwood
  • Unraveling Deflategate: Football stadium with closeup of football on field

    Unraveling the Tom Brady Deflategate

    The Deflategate scandal erupted following the 2014 AFC...
    Measurement
    By: Greg Cenker and Henry Zumbrun
Manage My Account
  • eMagazine Subscriptions
  • Newsletters
  • Online Registration
  • Subscription Customer Service
  • Manage My Preferences

More Videos

Sponsored Content

Sponsored Content is a special paid section where industry companies provide high quality, objective, non-commercial content around topics of interest to the Quality audience. All Sponsored Content is supplied by the advertising company and any opinions expressed in this article are those of the author and not necessarily reflect the views of Quality or its parent company, BNP Media. Interested in participating in our Sponsored Content section? Contact your local rep!

close
  • Key Takeaways for Quality Leaders
    Sponsored byComplianceQuest

    Key Takeaways for Quality Leaders from the 2026 Gartner Magic Quadrant™ for QMS

  • This image shows a person seated next to a Bobcat T66 compact track loader.
    Sponsored byPolyWorks by InnovMetric

    Supercharging Digital Gauging at Bobcat North America

  • Dorsey Calibration Lab photo by Tom LaBarbera Picture this Studios
    Sponsored byDorsey Metrology International

    Ensuring Product Quality in a Competitive Manufacturing Landscape

Popular Stories

This image shows a person seated next to a Bobcat T66 compact track loader.

Supercharging Digital Gauging at Bobcat North America

Dorsey Calibration Lab photo by Tom LaBarbera Picture this Studios

Ensuring Product Quality in a Competitive Manufacturing Landscape

a professional in the aviation field performing maintenance, repair, and overhaul (MRO) work

Manufacturing Retention: Strategies for Improving Company Culture, Engagement and Skill Development

2026 Quality Professional of the Year!

Events

June 22, 2026

Automate 2026

Automate is North America's largest robotics and automation event — and the best place to take your ideas from insight to impact.
 
Our show floor features the world’s leading automation solutions, from AI and robotics to motion control, vision systems, and more. Plus, our educational conference is second to none, led by the brightest minds in automation today.
 
Ready to transform the way you work? Take the next step at Automate.
July 14, 2026

Quality Leaders Forum: Better Communication, Better Quality Data

The Quality Leaders Forum is a quarterly, editor-moderated fireside chat series hosted by Quality Magazine, featuring candid conversations with senior manufacturing and operations executives shaping enterprise-level quality.

View All Submit An Event

Products

Lean Manufacturing and Service Fundamentals, Applications, and Case Studies

Lean Manufacturing and Service Fundamentals, Applications, and Case Studies

See More Products
Quality Podcast Channel Custom Content

Related Articles

  • engine block

    Hidden Waviness: When Measuring Roughness Cannot Solve Quality Challenges

    See More
  • QM0521-FT-Measurement-p1FT-digital_metrology-1170x878.jpg

    GD&T’s New Rule and What it means for Measurement

    See More
  • Surface Texture Gage Capability-B46.1 Surface Metrology Update

    See More

Related Products

See More Products
  • Gaging and Inspection Tool Design DVD

See More Products

Related Directories

  • Michigan Metrology LLC

    Michigan Metrology provides volume inspection services, consulting, and training in surface roughness, wear, texture, finish, flatness and more. Using advanced 3D surface roughness measurement, and expert understanding of 3D surface metrology, the company has helped thousands of clients with solutions for surface development, manufacturing process issues and product warranty concerns.
  • Surface Scan

    Professional 3D scanning, CAD, and 3D printing services across the UK. We offer in-house and mobile scanning using advanced equipment for metrology, terrestrial, and color capture. Our high-capacity print facility delivers fast turnaround on thousands of plastic parts. Trusted by engineers, manufacturers, and designers for precision, speed, and quality.
  • Spectrum Metrology

    Spectrum Metrology is the approved technical/applications support and service center for the world-renowned Taylor Hobson range of electro-optical metrology products, including autocollimators, Micro Alignment Telescopes, Clinometers and precision electronic levels. Taylor Hobson is an Ametek ultra-precision technology company operating at the highest levels of accuracy within the field of surface and form metrology and alignment.
×

Stay in the know with Quality’s comprehensive coverage of
the manufacturing and metrology industries.

Newsletters | Website | eMagazine

JOIN TODAY!
  • RESOURCES
    • Advertise
    • Contact Us
    • Directories
    • Manufacturing Division
    • Store
    • Want More
  • SIGN UP TODAY
    • Create Account
    • eMagazine
    • Newsletters
    • Customer Service
    • Manage Preferences
  • SERVICES
    • Marketing Services
    • Market Research
    • Reprints
    • List Rental
    • Survey/Respondent Access
  • STAY CONNECTED
    • LinkedIn
    • Facebook
    • YouTube
    • X (Twitter)
  • PRIVACY
    • PRIVACY POLICY
    • TERMS & CONDITIONS
    • DO NOT SELL MY PERSONAL INFORMATION
    • PRIVACY REQUEST
    • ACCESSIBILITY

Copyright ©2026. All Rights Reserved BNP Media, Inc. and BNP Media II, LLC.

Design, CMS, Hosting & Web Development :: ePublishing