Machine Vision
Lighting Design for Machine Vision, Part 1
No lighting design methodology is guaranteed to create adequate illumination. It is always necessary to test, verify, and refine the approach before finalizing the solution.
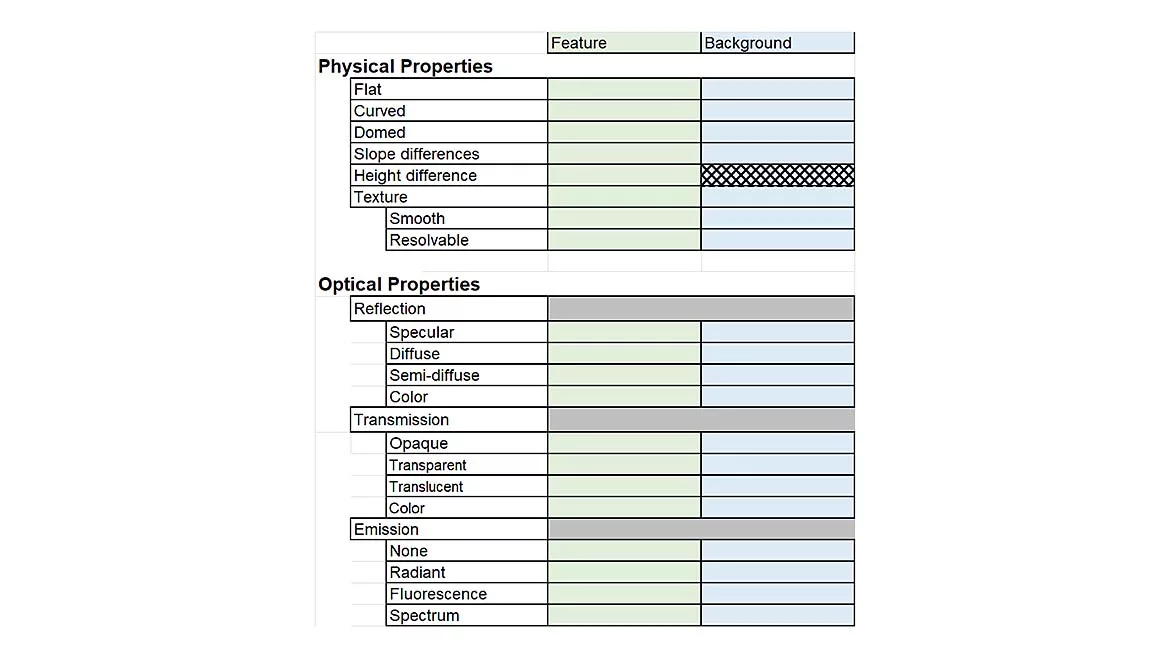
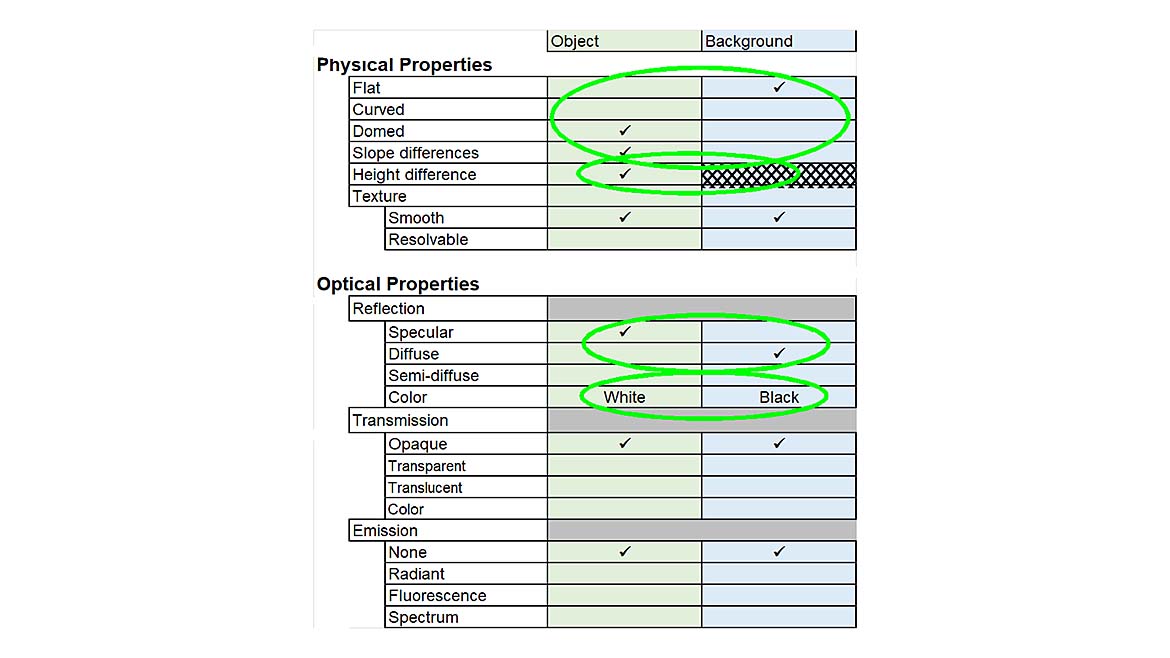
Figure 1: Scene Analysis Form
This is the first of five articles to help you design lighting for machine vision. This first article examines contrast and introduces the scene analysis form to identify characteristics of parts and backgrounds that create contrast. The second article surveys light sources used in machine vision, introduces the lighting cube, and shows how the light sources map onto the lighting cube. The third article shows how to map physical and optical properties of features and backgrounds from the scene analysis form onto the lighting cube. The fourth article shows how combining both the scene and the light sources mapped onto the lighting cube allows selection of a candidate light source to create contrast. The fifth article covers the use of color and polarization in machine vision lighting, along with a few examples requiring unique solutions.
No lighting design methodology, including the one outlined in this series of articles, is guaranteed to create adequate illumination. It is always necessary to test, verify, and very possibly refine the approach before finalizing the solution. Also, there are uncommon complex conditions not anticipated by any lighting design methodology. These conditions require the machine vision lighting designer to have a very good grasp of optical principles. One source for acquiring these principles is the series of online videos on Optics for Machine Vision. (Note, you need to enable cookies to view these videos.)
Another challenge to lighting design for machine vision is the lack of quantitative optical specifications for the parts being imaged. Mechanical drawings show sizes, tolerances, and sometimes finish quality. Mechanical finish quality does not translate directly into optical terms, and it does not specify the range of optical characteristics. To correctly quantify optical properties would take a collection of expensive instruments along with a large set of samples representing the spectrum of optical characteristics for a given part. The labor in gathering the quantified data far exceeds the labor to make an informed, if subjective, hypothesis, and then testing and refining it. The use of the tools presented in this series of articles gives you a good methodology for beginning the design of lighting for a machine vision application without the need for complex, expensive optical instrumentation.
Contrast
In machine vision, contrast is the signal. Simply put, contrast is the difference in gray levels or colors between a feature and its background.
There are three formulas for contrast:
Contrast Modulation:
(I_MAX- I_MIN)/(I_MAX+ I_MIN )
Contrast Ratio:
I_MAX/I_MIN
Contrast Difference:
I_MAX- I_MIN
While contrast modulation is used in most technical articles and in common activities like calculating the modulation transfer function (MTF) of a lens, the contrast difference is a better measure of contrast for lighting and imaging design. Where contrast modulation and contrast ratio are unitless values, contrast difference has units such as gray levels. This means contrast difference can be combined with a noise measurement, with the same units, to provide a signal-to-noise figure of merit.
Lighting is the principal determinant of contrast in a machine vision image. The camera and lens play a role, but of significantly less magnitude. The goal of lighting must be to establish the needed contrast between a feature and its background, and, in some cases, to simultaneously suppress the contrast of unwanted artifacts.
Scene Analysis
The first question is what in the image needs to have contrast? For the purpose of this article, call one object the feature and the surrounding object the background. We can group properties into two categories: physical properties and optical properties. These can be recorded in a basic form shown in Figure 1, the scene analysis form.
The basic scene analysis form provides a convenient way to identify characteristics of the scene that create contrast as well as those characteristics that do not create contrast. It is possible to expand the form adding more columns for more features and more rows for more detailed information on characteristics.
The scene analysis form template, in Excel format, is available at:
https://docs.google.com/spreadsheets/d/1eGl5eAtNj4DbTJQKhEVu6VtS895WHJqa/edit?usp=drive_link&ouid=103496824013998998459&rtpof=true&sd=true. Of course, you are able to modify the template or create your own.
Physical Properties
Flat objects are planar. However, flat surfaces can have a tip or tilt that affect how the illumination must be designed.
Curved surfaces are often round. They can also be convex or concave (partially round). Slope differences occur when the feature or background has regions of differing slopes. Height differences mean the feature is at a different height than the background; it can be either higher or lower than the background.
Optical Properties
There are three general categories of optical properties: reflection, transmission, and emission. A feature or the background can have characteristics of one or more optical properties.
Reflection
One property of reflection is how it scatters the incident light. When reflected light is not scattered, and the angle of reflection equals the angle of incidence, like off a mirror, the surface is shiny and is called specular. At the other extreme is reflected light scattered over a wide range of angles, say ±90 degrees. These surfaces are considered highly diffuse. A surface that scatters light over a narrow range of angles is semi-diffuse.
On specular surfaces, you see reflections of the environment distorted by any curvature of the feature. On very diffuse surfaces, the lighting appears fairly uniform with no hot spots. On semi-diffuse surfaces, objects in the environment are not clearly reflected, and illumination, either ambient or engineered, can provide hot spots.
Another property of reflection is color or spectrum. An object, either feature or background, can reflect some light wavelengths more strongly than others. Generally, this property is noted simply as color such as red, green, blue, off-white, etc. Color is extremely important and useful in machine vision lighting design.
More advanced applications, such as determining the ripeness of fruit, may require a detailed spectral analysis. Where spectral analysis is required, the application needs the spectrum of the reflected light from both the feature and the background to know what light wavelengths to use to discriminate the features. For these instances, a simple color label is probably insufficient.
Transmission
Features can exhibit transmission properties ranging from opaque, no transmission – the material blocks all light passing through it, through transparent where light passes through the feature without scattering.
For transparent materials, objects are visible through the feature, although they can be distorted by refraction due to the shape of the feature. A special case of transparent features is absent material. In other words, a hole through a part. There is no refraction, and whatever can be viewed through the hole is undistorted.
There are also translucent materials that scatter light as it is transmitted. Features behind translucent materials are not resolvable in the image.
Except for absent material, transparent and translucent materials also reflect light. The magnitude of reflection depends on the angle of incidence of the light, the index of refraction of the material, and the amount of scattering that sends light back to the side of the part being illuminated.
Many transmissive materials pass some wavelengths and absorb other wavelengths. The wavelengths they transmit give these materials their characteristic color.
Emission
Although most parts don’t emit light, some parts do emit light. Of those that emit light, some are self-emitters. Warm to hot objects emit infrared. Very hot objects emit visible light. Displays often emit their own light. Then there are materials that fluoresce. When illuminated by a suitable wavelength of light, usually ultraviolet, these materials emit light at a longer wavelength, usually in the visible region.
Example 1
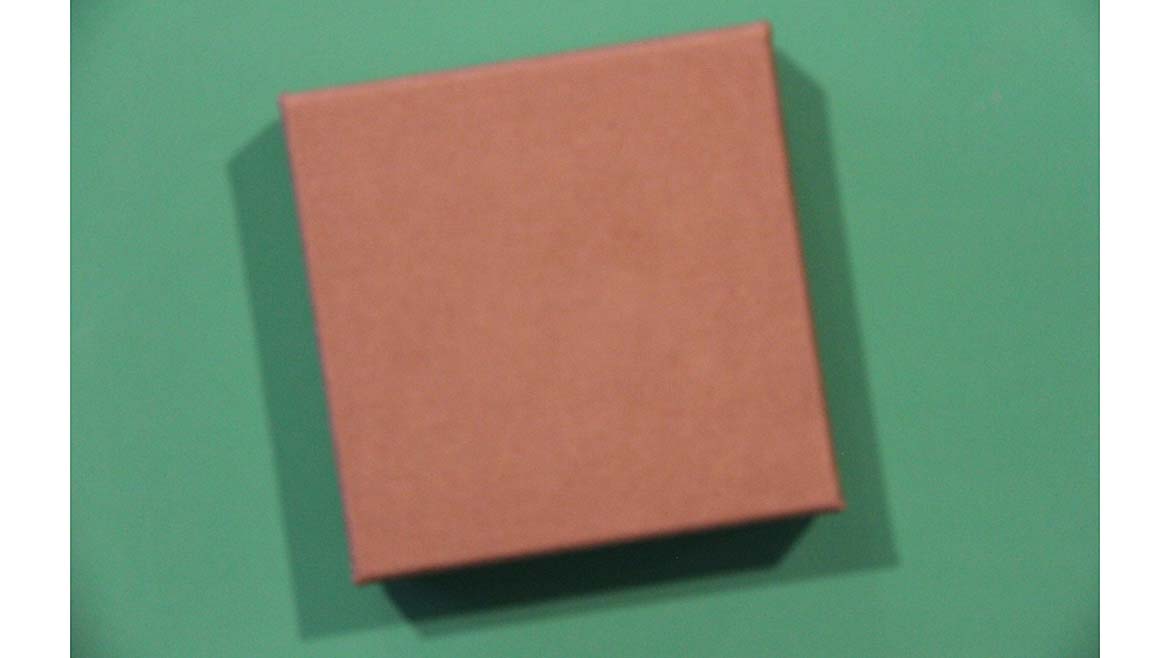
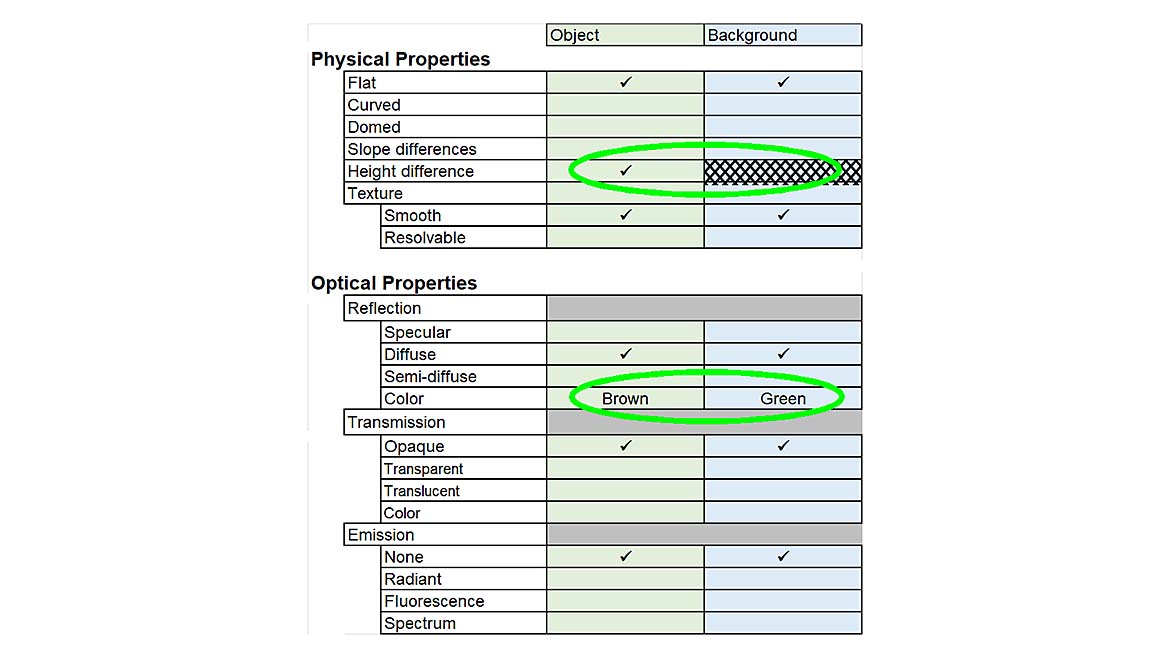
To see how you would use the scene analysis form, take the example of a brown box setting on a green background shown in Figure 2. The objective could be to locate the box for a robot to pick up. Figure 3 shows the scene analysis form for this example. Both the object and background are flat, diffusely reflective, opaque, and don’t emit any light. There is a clear difference in height between the top of the box and the background. Also, the reflected colors of the box and background are different. The differences, circled in Figure 3, are the properties you can use to create contrast.
Source: Perry West
Source: Perry West
Experienced machine vision lighting engineers have a mental process that mirrors the scene analysis form. They always start by looking for the optical differences in objects in the scene to use to create contrast. The scene analysis form is a tool for people who do not design machine vision lighting very often as well as for more experienced lighting designers who need to document their approach to the solution.
One final thought. What if boxes came in different colors and one of those colors was green? Then color would not be a property to generate reliable contrast, and the solution might need to focus on height differences and shadows cast by the box.
Example 2
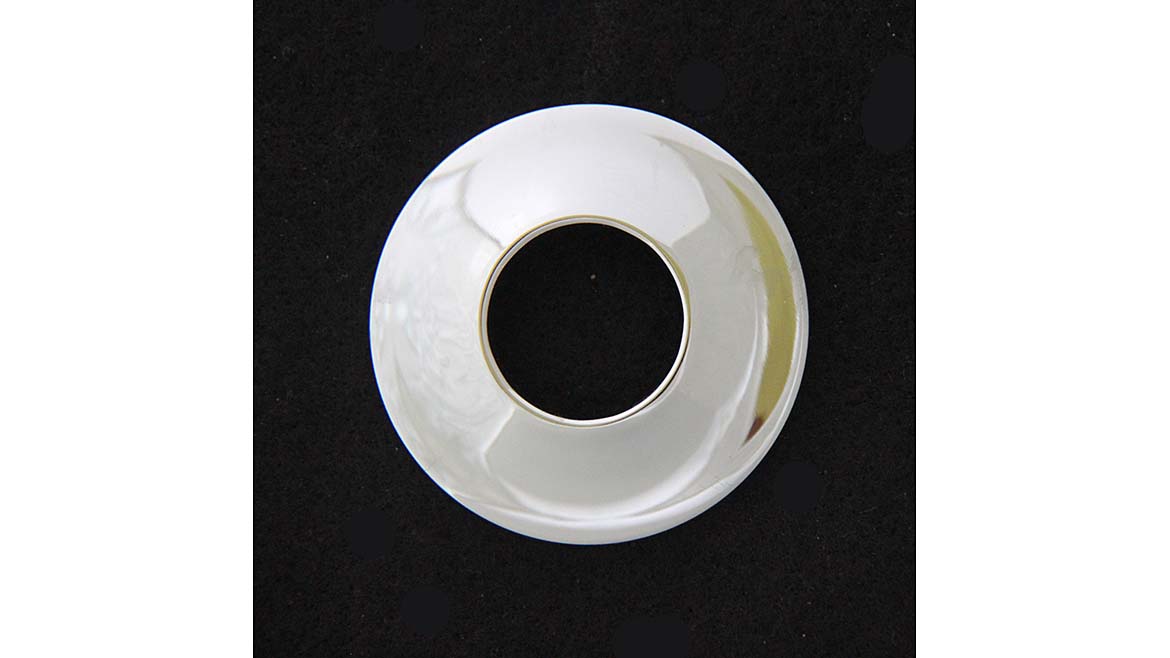
Here is another example, a shiny plumbing escutcheon on a black background (see Figure 4). This part is specular (shiny) and can be very difficult to illuminate uniformly without glints or glare.
Source: Perry West
Source: Perry West
Figure 5 shows the scene analysis form for this object and its background. The features usable for creating contrast are circled.
Example 3
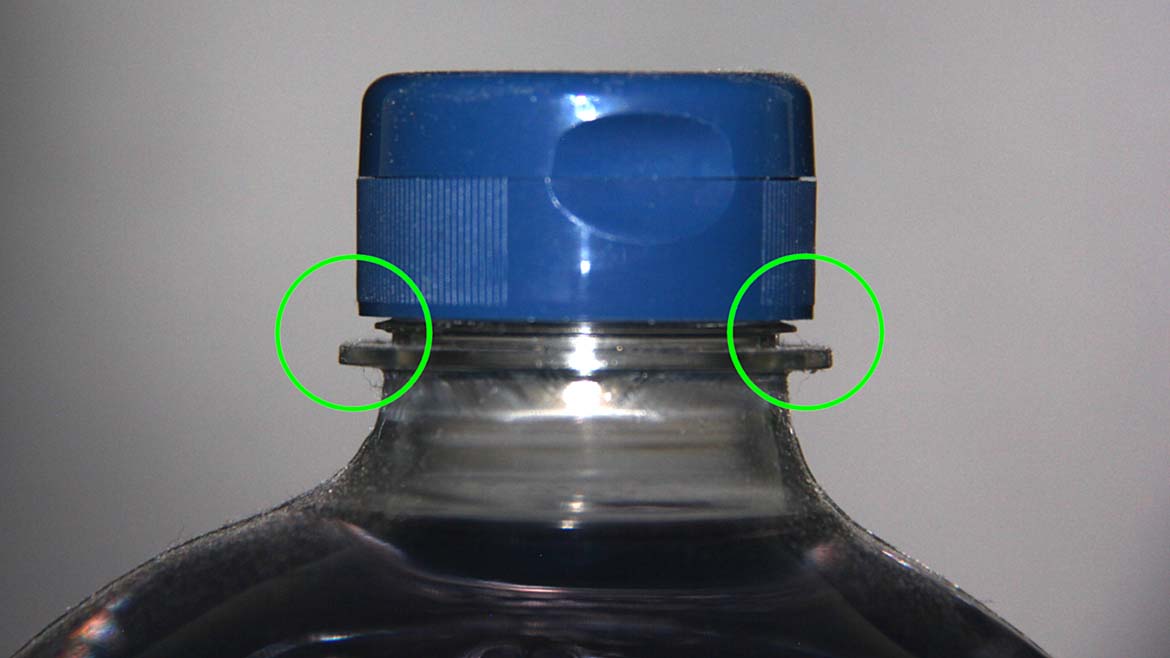
In this example, from a real application, the requirement was to verify the cap on a bottle was seated correctly. This could be done by measuring the gap between the bottom of the cap and a flange on the bottle for each side of the bottle. (See Figure 6.)
Two aspects of this application are important. One aspect is there are two different materials, the cap and the bottle, that make up the features of interest – the gaps. Another aspect is the background is unspecified. Yet every feature in an image has a background. In machine vision, the background must be controlled along with the illumination to ensure contrast.
Source: Perry West
Source: Perry West
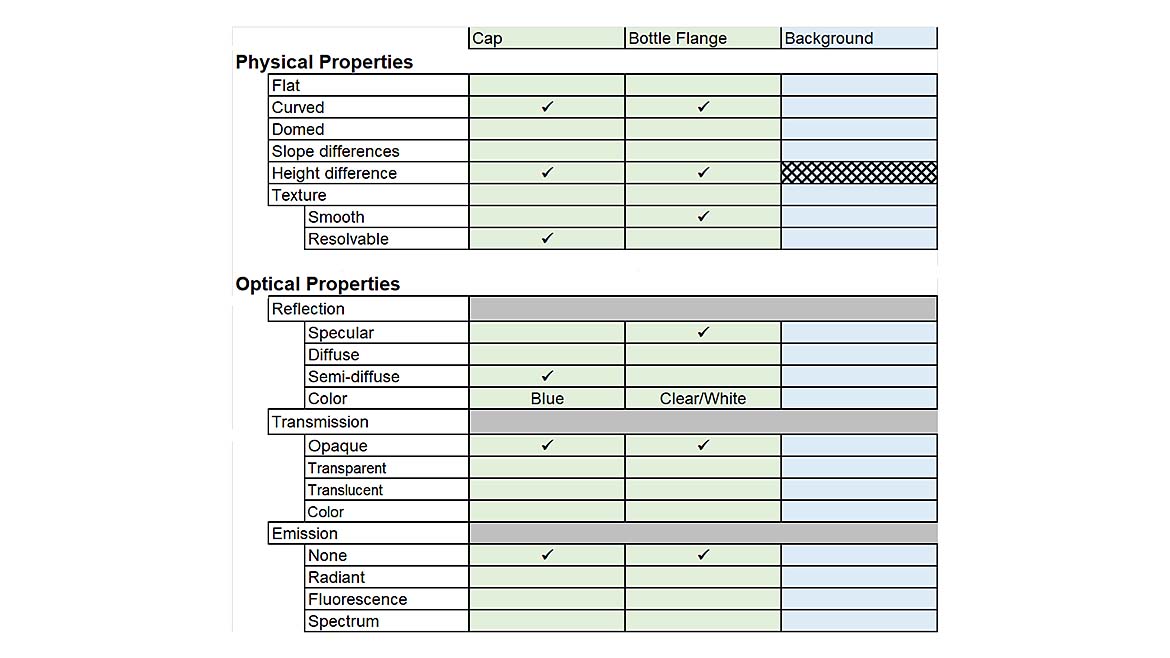
The scene analysis form, shown in Figure 7, gets modified for this application by the addition of an additional column. This is because there are actually two different features, the cap and the bottle flange, that form the gap to measure. Each feature has different characteristics to image to create contrast. Other columns can be added to represent features you need to exclude from the image to eliminate or minimize contrast with the background as they represent noise. You can modify the scene analysis form to meet your project’s needs.
It should be noted that the gap is the feature needing measurement. The gap is actually part of the background. Therefore, both the cap and the bottle flange must contrast with the background.
For now, leave the background column empty since it is not specified. The third article in this series returns to this application to show how the light sources discussed in the second article in this series can be combined with the information from the scene analysis form to identify likely candidate lighting techniques.
Conclusion
This article introduces the scene analysis form – a useful tool for identifying and documenting the physical and optical characteristics of most features useful to create contrast.
The next article in the series introduces the lighting cube for characterizing the direction of lighting and shows how most common machine vision light sources map onto the lighting cube. The following articles build on these first two articles to help further your ability to engineer machine vision lighting.
Looking for a reprint of this article?
From high-res PDFs to custom plaques, order your copy today!


")

