Quality Magazine logo
search
cart
facebook twitter linkedin youtube
  • Sign In
  • Create Account
  • Sign Out
  • My Account
Quality Magazine logo
  • NEWS
  • PRODUCTS
    • FEATURED PRODUCTS
    • SUBMIT YOUR PRODUCT
  • CHANNELS
    • AUTOMATION
    • MANAGEMENT
    • MEASUREMENT
    • NDT
    • QUALITY 101
    • SOFTWARE
    • TEST & INSPECTION
    • VISION & SENSORS
  • MARKETS
    • AEROSPACE
    • AUTOMOTIVE
    • ENERGY
    • GREEN MANUFACTURING
    • MEDICAL
  • MEDIA
    • A WORD ON QUALITY PUZZLE
    • EBOOKS
    • PODCASTS
    • VIDEOS
    • WEBINARS
  • EVENTS
    • EVENT CALENDAR
    • IMTS
  • DIRECTORIES
    • BUYERS GUIDE >
      • Supplier Insights
    • NDT SOURCEBOOK
    • VISION & SENSORS
    • TAKE A TOUR
  • INFOCENTERS
    • Digital Quality Management Systems
    • NEXT GENERATION SPC & QUALITY ANALYTICS
  • AWARDS
    • ROOKIE OF THE YEAR
    • PLANT OF THE YEAR
    • PROFESSIONAL OF THE YEAR
  • MORE
    • Expert Columns
    • NEWSLETTERS
    • QUALITY STORE
    • INDUSTRY LINKS
    • SPONSOR INSIGHTS
  • EMAG
    • eMAGAZINE
    • ARCHIVES
    • CONTACT
    • ADVERTISE
  • SIGN UP!
Measurement

Measurement

Measuring Manufacturing Effectiveness: Downtime Frequency and Duration

Downtime behavior influences performance and quality beyond its direct impact on availability.

By Ray Harkins
Automated automotive assembly line with robotic systems and vehicle bodies moving through a modern car manufacturing facility.
Image credit: alvarez / Getty Images (Creative #1383557380)
June 25, 2026

This article is adapted from Chapter 6 of my book, “Measuring Manufacturing Effectiveness.”

The book examines how manufacturing organizations define and use performance metrics, and how those measurement choices influence decisions, priorities, and behavior on the shop floor and in management. While the chapters are organized as a cohesive framework, each one is written to address a specific aspect of manufacturing effectiveness and can be read independently.

Chapter 6 focuses on a critical but often oversimplified topic: downtime.

Most organizations track downtime in some form, but far fewer distinguish meaningfully between how often downtime occurs and how long it lasts. These two dimensions -- frequency and duration -- are frequently combined, averaged, or summarized in ways that mask important operational realities.

This chapter explores why separating downtime frequency from downtime duration matters, how each dimension points to different underlying causes, and how failing to distinguish between them can lead to ineffective or misdirected improvement efforts.

Downtime Frequency and Duration

Availability depends jointly on interruption frequency and recovery duration. These dimensions describe different operational behaviors.

  • Frequent short interruptions indicate lower MTBF and lower MTTR
  • Infrequent long interruptions indicate higher MTBF and higher MTTR

Both patterns may produce similar total downtime while creating markedly different production environments. Availability alone does not distinguish between these behaviors; MTBF and MTTR together provide the necessary context.

Frequent Short Interruptions

With a lower MTBF and MTTR, production is repeatedly interrupted and restarted. Individual events are brief, but cumulative disruption is significant.

This pattern is often normalized at the operator level. Interruptions may be described as resets, nuisance stops, or momentary faults, and without an automated data collection system, are inconsistently recorded. As a result, reported downtime may understate the true impact on production flow and stability.

Operational consequences of frequent short interruptions include:

  • Fragmented production
  • Repeated ramp-up losses
  • Increased operator workload
  • Erosion of standard work
  • Increased susceptibility to quality instability

Although recovery is rapid, the production system rarely operates in a sustained steady state.

Infrequent Long Interruptions

With a higher MTBF and MTTR, failures are rare but highly disruptive. These events are typically visible to supervision and management and trigger formal response processes.

Despite their severity, infrequent long interruptions are often easier to plan around. Production schedules can be adjusted, resources reassigned, and corrective actions documented. These events are almost always captured accurately in downtime reporting.

Figure 5 illustrates the key differences between the interruption types.

Equal Downtime, Different Operational Reality

Systems with equal total downtime can impose very different operational demands.

Frequent interruptions impose continuous cognitive and procedural load on operators and supervisors. Infrequent interruptions impose episodic disruption but allow extended periods of uninterrupted production.

Total downtime does not distinguish between these realities. Downtime behavior does.

Chart illustrating the relationship between MTBF (Mean Time Between Failures) and MTTR (Mean Time To Repair), comparing frequent short equipment stops with rare long downtime events that result in equal total downtime.

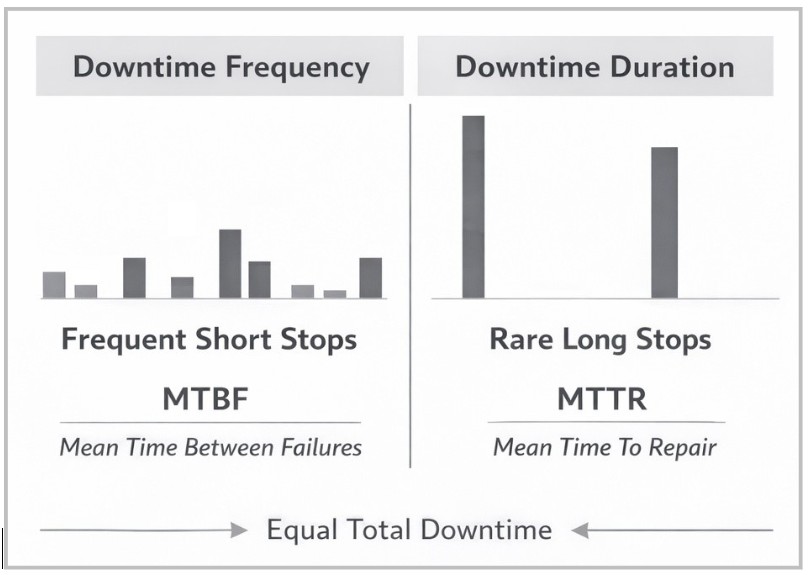
Figure 5: Downtime Frequency versus Downtime Duration. Image credit: Ray Harkins

Secondary Effects of Downtime Behavior

Downtime behavior influences performance and quality beyond its direct impact on availability.

Frequent interruptions increase the likelihood of:

  • Performance loss during repeated ramp-up
  • Quality loss during restart and stabilization
  • Operator workarounds
  • Informal adjustments that bypass standard controls

These effects are often misclassified as performance inefficiency or quality problems, when their origin lies in interruption behavior.

Matching Improvement Strategy to Downtime Behavior

Effective improvement requires alignment between downtime behavior and corrective action.

  • Frequent interruptions indicate the need for reliability improvement and robustness
  • Long interruptions indicate the need for improved maintainability and recovery capability

Treating all downtime as equivalent leads to misdirected effort and limited improvement.

Availability as a Management Lever

Availability reflects decisions made across design, maintenance strategy, staffing, training, and operational authority. It is not a passive outcome.

In many operations, reducing MTTR yields faster and more predictable gains than attempting to eliminate failures entirely. Incremental reductions in recovery time, applied repeatedly, can recover more production capacity than eliminating infrequent failure modes.

Availability establishes the ceiling for performance and quality. If equipment cannot run when scheduled, downstream improvements have no effective domain.

Key Takeaways

  • Availability loss arises from both interruption frequency and recovery duration, which describe fundamentally different operational behaviors.
  • Frequent short interruptions and infrequent long interruptions can produce similar total downtime while creating very different production environments.
  • Total downtime alone does not capture downtime behavior; MTBF and MTTR together provide the necessary context.
  • Frequent interruptions disproportionately disrupt flow, increase ramp-up losses, and elevate risk of performance and quality instability.
  • Effective improvement requires matching corrective action to downtime behavior rather than treating all downtime as equivalent.

Understanding how downtime occurs is as important as knowing how much downtime occurs, because behavior and totals together determine its operational impact.

This chapter is part of Measuring Manufacturing Effectiveness, a 12-chapter framework that examines how manufacturing performance metrics are defined, interpreted, and used to guide improvement and decision-making.

The complete book brings these ideas together into a coherent measurement system, supported by figures, equations, and practical examples that place topics like downtime, Availability, Performance, and Quality into a broader operational context.

LEARN MORE

  • The Strategic Importance of Data Collection in Modern Metrology
  • 3 Characteristics of Smart Data Collection
  • Reduce Testing Downtime through Quality Measures
KEYWORDS: data collection manufacturing metrology

Share This Story

Looking for a reprint of this article?
From high-res PDFs to custom plaques, order your copy today!

Ray Harkins is the General Manager of Lexington Technologies in Lexington, North Carolina. He earned his Master of Science from Rochester Institute of Technology and his Master of Business Administration from Youngstown State University. He also taught over 100,000 student quality-related skills such as Gage R&R Simplified: Essential Tools for Quality Engineers, Quality Engineering Statistics, and Root Cause Analysis and the 8D Corrective Action Process through the online learning platform, Udemy. He can be reached via LinkedIn at linkedin.com/in/ray-harkins or by email at [email protected]. www.TheManufacturingAcademy.com.

Recommended Content

JOIN TODAY
to unlock your recommendations.

Already have an account? Sign In

  • 2024 Quality Rookie of the Year Justin Wise 1440x750px banner with "Quality Rookie of the Year" logo inset

    Meet the 2024 Quality Rookie of the Year: Justin Wise

    Justin Wise is an exceptional individual who has been...
    Aerospace
    By: Michelle Bangert
  • Man with umbrella and coat stands outside while it rains at night looking at a building.

    Nondestructive Testing: Is there an ethics problem?

    I was a whistleblower who exposed fraudulent activities...
    NDT
    By: Dale Norwood
  • Unraveling Deflategate: Football stadium with closeup of football on field

    Unraveling the Tom Brady Deflategate

    The Deflategate scandal erupted following the 2014 AFC...
    Measurement
    By: Greg Cenker and Henry Zumbrun
Manage My Account
  • eMagazine Subscriptions
  • Newsletters
  • Online Registration
  • Subscription Customer Service
  • Manage My Preferences

More Videos

Sponsored Content

Sponsored Content is a special paid section where industry companies provide high quality, objective, non-commercial content around topics of interest to the Quality audience. All Sponsored Content is supplied by the advertising company and any opinions expressed in this article are those of the author and not necessarily reflect the views of Quality or its parent company, BNP Media. Interested in participating in our Sponsored Content section? Contact your local rep!

close
  • Key Takeaways for Quality Leaders
    Sponsored byComplianceQuest

    Key Takeaways for Quality Leaders from the 2026 Gartner Magic Quadrant™ for QMS

  • This image shows a person seated next to a Bobcat T66 compact track loader.
    Sponsored byPolyWorks by InnovMetric

    Supercharging Digital Gauging at Bobcat North America

  • Dorsey Calibration Lab photo by Tom LaBarbera Picture this Studios
    Sponsored byDorsey Metrology International

    Ensuring Product Quality in a Competitive Manufacturing Landscape

Popular Stories

iStock-1352825159-jpg.jpg

U.S. Should Substantially Boost Support for Manufacturing USA Program, Issue National Industrial Manufacturing Strategy, Says New Report

a factory floor during what appears to be a training session or a daily briefing

The Root Cause of Defects We Rarely Name or Address

Dorsey Calibration Lab photo by Tom LaBarbera Picture this Studios

Ensuring Product Quality in a Competitive Manufacturing Landscape

2026 Quality Professional of the Year!

Events

July 14, 2026

Quality Leaders Forum: Better Communication, Better Quality Data

The Quality Leaders Forum is a quarterly, editor-moderated fireside chat series hosted by Quality Magazine, featuring candid conversations with senior manufacturing and operations executives shaping enterprise-level quality.

August 12, 2026

Eliminate Manual FAI Processes and Reduce Inspection Time by Up to 90%

Discover how advanced FAI software automates First Article Inspection workflows by generating inspection plans, validating results in real time, integrating 2D/3D data, and reducing quality escapes to improve efficiency and compliance.

View All Submit An Event

Products

Lean Manufacturing and Service Fundamentals, Applications, and Case Studies

Lean Manufacturing and Service Fundamentals, Applications, and Case Studies

See More Products
Rookie of the Year Custom Content

Related Articles

  • This image shows a person in personal protective equipment (PPE) using a tablet, likely in an industrial or construction setting

    Cohen’s Kappa: Measuring Agreement Beyond Chance

    See More
  • The group of dial indicator gauge on the table with lighting effect.

    Making Sense of Gage R&R Analysis

    See More
  • Case Study: Boa Vision System Shines at Reducing Downtime on Aluminum Line

    See More

Related Products

See More Products
  • Measuring Quality Improvement in Healthcare

  • smart manu.jpg

    Smart Manufacturing Factory Artificial-Intelligence-Driven Customized Manufacturing

  • Fundamentals of Manufacturing, 3rd Edition

See More Products
×

Stay in the know with Quality’s comprehensive coverage of
the manufacturing and metrology industries.

Newsletters | Website | eMagazine

JOIN TODAY!
  • RESOURCES
    • Advertise
    • Contact Us
    • Directories
    • Manufacturing Division
    • Store
    • Want More
  • SIGN UP TODAY
    • Create Account
    • eMagazine
    • Newsletters
    • Customer Service
    • Manage Preferences
  • SERVICES
    • Marketing Services
    • Market Research
    • Reprints
    • List Rental
    • Survey/Respondent Access
  • STAY CONNECTED
    • LinkedIn
    • Facebook
    • YouTube
    • X (Twitter)
  • PRIVACY
    • PRIVACY POLICY
    • TERMS & CONDITIONS
    • DO NOT SELL MY PERSONAL INFORMATION
    • PRIVACY REQUEST
    • ACCESSIBILITY

Copyright ©2026. All Rights Reserved BNP Media, Inc. and BNP Media II, LLC.

Design, CMS, Hosting & Web Development :: ePublishing